National Drug Strategy Household Survey 2022–2023:
Use of alcohol and other drugs in Major cities, regional areas, and remote areas
Web article
Last updated:
Topic: Rural & remote Australians
Citation
AIHW
Australian Institute of Health and Welfare (2024) Use of alcohol and other drugs in Major cities, regional areas, and remote areas, AIHW, Australian Government, accessed 01 May 2024.
APA
Australian Institute of Health and Welfare. (2024). Use of alcohol and other drugs in Major cities, regional areas, and remote areas. Retrieved from https://pp.aihw.gov.au/reports/rural-remote-australians/alcohol-drugs-geographic-areas
MLA
Use of alcohol and other drugs in Major cities, regional areas, and remote areas. Australian Institute of Health and Welfare, 29 February 2024, https://pp.aihw.gov.au/reports/rural-remote-australians/alcohol-drugs-geographic-areas
Vancouver
Australian Institute of Health and Welfare. Use of alcohol and other drugs in Major cities, regional areas, and remote areas [Internet]. Canberra: Australian Institute of Health and Welfare, 2024 [cited 2024 May. 1]. Available from: https://pp.aihw.gov.au/reports/rural-remote-australians/alcohol-drugs-geographic-areas
Harvard
Australian Institute of Health and Welfare (AIHW) 2024, Use of alcohol and other drugs in Major cities, regional areas, and remote areas, viewed 1 May 2024, https://pp.aihw.gov.au/reports/rural-remote-australians/alcohol-drugs-geographic-areas
Changes in drug use by Remoteness Areas
Tobacco, alcohol and other drug use are major health issues in Australia and are associated with a number of harms, both physical and social. People living in remote areas in Australia often have worse health outcomes than people living in metropolitan areas (AIHW 2019).
In 2022–2023, Remoteness Areas were defined using the 2021 Australian Statistical Geography Standard (ASGS). In 2019, Remoteness Areas were defined using the 2016 ASGS. In 2013 and 2016, Remoteness Areas were defined using the 2011 ASGS. Prior to this, the 2006 Australian Standard Geographical Classification (ASGC) was used. The data are considered comparable but trends should be interpreted with caution.
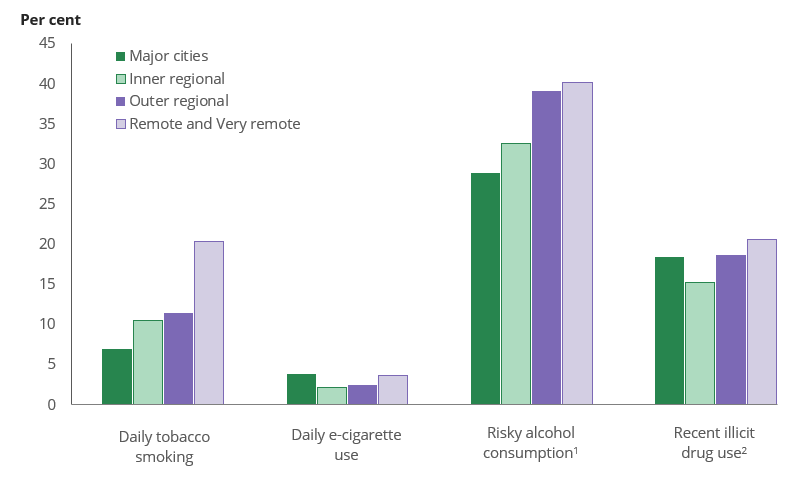
Figure 1: Use of drugs among people aged 14 and over, by Remoteness Area, 2022–2023
Notes
- Derived from 2020 NHMRC alcohol guideline 1: Had more than 10 standard drinks per week or more than 4 standard drinks on a single day at least once a month on average.
- Used at least 1 of 17 classes of illicit drugs in the previous 12 months in 2022–2023.
Source: Tables 3.11 and 9a.12.
Daily smoking highest in Remote and Very remote areas
The proportion of people who smoked tobacco daily decreased in most areas between 2019 and 2022–2023. Substantial drops occurred in Major cities (from 9.7% in 2019 to 7.0% in 2022–2023), Inner regional areas (from 13.4% to 10.5%), and Outer regional areas (from 15.9% to 11.4%). The proportion of people who smoked daily in Remote and Very remote areas remained stable between 2019 (19.6%) and 2022–2023 (20%).
These changes have resulted in a higher disparity in smoking between Remote and Very remote areas and other areas. In 2019, people in Remote and Very remote areas were 2.0 times as likely to smoke daily as people in Major cities. In 2022–2023, that difference increased to 2.9 times as likely (Figure 1).
Daily use of e‑cigarettes increased except in Remote and Very remote areas
The proportion of people who used e‑cigarettes daily increased in most remoteness areas between 2019 and 2022–2023. Increases occurred in Major cities (from 1.1% in 2019 to 3.9% in 2022–2023), Inner regional areas (from 0.9% to 2.2%), and Outer regional areas (from *0.8% to 2.5%). There was no change in the proportion of people using e‑cigarettes daily in Remote and Very remote areas (*3.7%).
* Estimate has a relative standard error of 25% to 50% and should be interpreted with caution.
Risky drinking higher in more remote areas
Overall, the proportion of people drinking alcohol at risky levels remained steady between 2019 and 2022–2023 across all remoteness areas. There was no change in the proportion of people consuming more than 4 standard drinks on a single day at least once a month, or consuming more than 10 standard drinks per week on average.
There was a decline in the proportion of people drinking 10 or fewer standard drinks per week in Outer regional areas, from 52% in 2019 to 47% in 2022–2023.
In 2022–2023, risky drinking was more likely in more remote areas (Figure 1). People living in Remote and Very remote areas were the most likely to drink at risky levels (40%), and the lowest level of risky drinking occurred in Major cities (29%).
Illicit use of drugs increased in Major cities but remained steady in other areas
The proportion of people who had used any illicit drug in the last 12 months increased in Major cities between 2019 (16.7%) and 2022–2023 (18.4%). In Inner regional areas, Outer regional areas, and Remote and Very remote areas, the proportions were similar to 2019. Differences were small between remoteness areas in 2022–2023, ranging from 15.2% in Inner regional areas to 21% in Remote and Very remote areas (Figure 1).
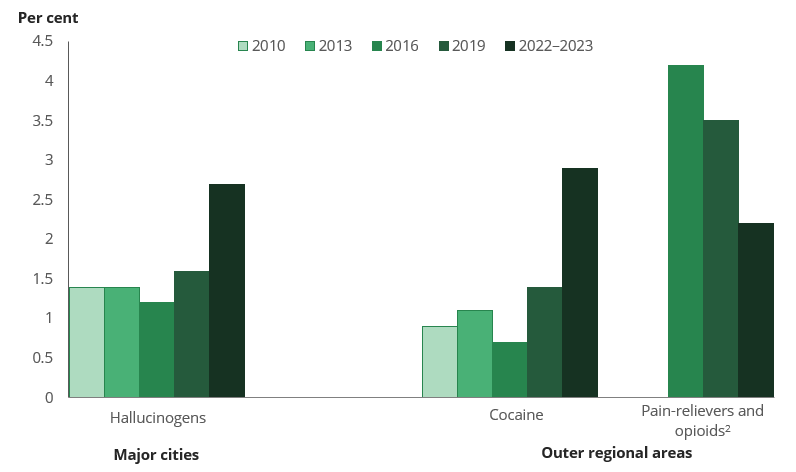
Figure 2: Recent1 illicit use of selected drugs in Major cities and Outer regional areas, 2010 to 2022–2023
Notes
- Uses in the previous 12 months.
- For non-medical purposes.
Source: Table 9a.12.
When examined by drug type, there were some changes between 2019 and 2022–2023 (Figure 2):
- Major cities saw an increase in the proportion of people who recently used hallucinogens, from 1.6% in 2019 to 2.7% in 2022–2023.
- Outer regional areas saw an increase in the proportion of people who recently used cocaine, from 1.4% to 2.9%.
- Outer regional areas saw a decrease in the proportion of people who recently used pain-relievers and opioids for non‑medical purposes, from 3.5% to 2.2%.