National Drug Strategy Household Survey 2022–2023:
Use of alcohol and other drugs by socioeconomic area
Web article
Last updated:
Topic: Social determinants
Citation
AIHW
Australian Institute of Health and Welfare (2024) Use of alcohol and other drugs by socioeconomic area, AIHW, Australian Government, accessed 01 May 2024.
APA
Australian Institute of Health and Welfare. (2024). Use of alcohol and other drugs by socioeconomic area. Retrieved from https://pp.aihw.gov.au/reports/social-determinants/alcohol-drugs-socioeconomic-area
MLA
Use of alcohol and other drugs by socioeconomic area. Australian Institute of Health and Welfare, 29 February 2024, https://pp.aihw.gov.au/reports/social-determinants/alcohol-drugs-socioeconomic-area
Vancouver
Australian Institute of Health and Welfare. Use of alcohol and other drugs by socioeconomic area [Internet]. Canberra: Australian Institute of Health and Welfare, 2024 [cited 2024 May. 1]. Available from: https://pp.aihw.gov.au/reports/social-determinants/alcohol-drugs-socioeconomic-area
Harvard
Australian Institute of Health and Welfare (AIHW) 2024, Use of alcohol and other drugs by socioeconomic area, viewed 1 May 2024, https://pp.aihw.gov.au/reports/social-determinants/alcohol-drugs-socioeconomic-area
In this article, the Index of Relative Socio-economic Advantage and Disadvantage (IRSAD) is used to classify individuals according to the socioeconomic characteristic of the area in which they live. It scores each area by summarising attributes of the population, such as income, educational attainment, unemployment rate and jobs in skilled or unskilled occupations (ABS 2021).
The areas are grouped into quintiles. The 20% of areas with the greatest overall level of socioeconomic disadvantage are described as the ‘lowest socioeconomic areas’. The 20% of areas with the greatest overall level of socioeconomic advantage – the top 20% – are described as the ‘highest socioeconomic areas’.
Note that the IRSAD reflects the overall or average level of advantage and disadvantage of the population of an area; it does not show how individuals living in the same area differ from each other in their socioeconomic position.
Figure 1: Use of drugs by socioeconomic area, people aged 14 and over, 2022–2023
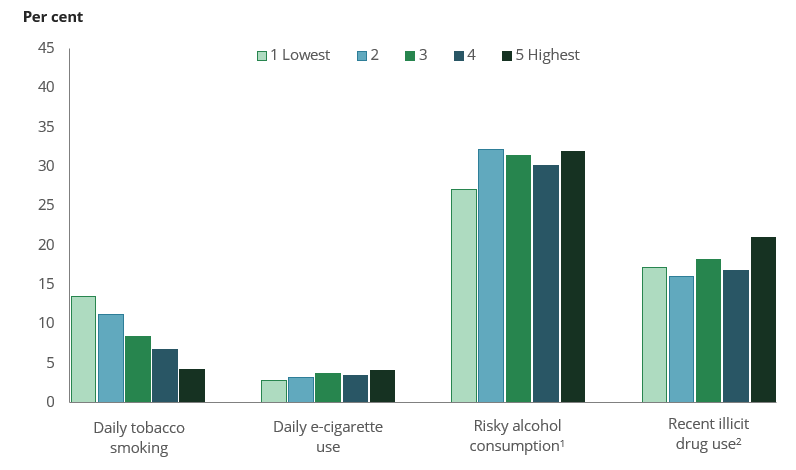
- Derived from 2020 NHMRC Alcohol guideline 1: Consumed more than 10 standard drinks per week or more than 4 standard drinks on a single day at least once a month on average.
- Used at least 1 of 17 classes of illicit drugs in the previous 12 months in 2022–2023.
Source: NDSHS 2022–2023, Tables 3.11 and 9a.14.
Daily smoking is highest in the most disadvantaged socioeconomic areas, but declining
Compared with 2019, the proportion of people who smoked tobacco daily declined in the lowest socioeconomic areas (from 18.1% in 2019 to 13.4% in 2022–2023), the second lowest socioeconomic areas (from 13.7% to 11.1%), and the third lowest socioeconomic areas (from 10.7% to 8.3%), as shown in Figure 2.
Figure 2: Daily smoking by socioeconomic area, people aged 14 and over, 2010 to 2022–2023
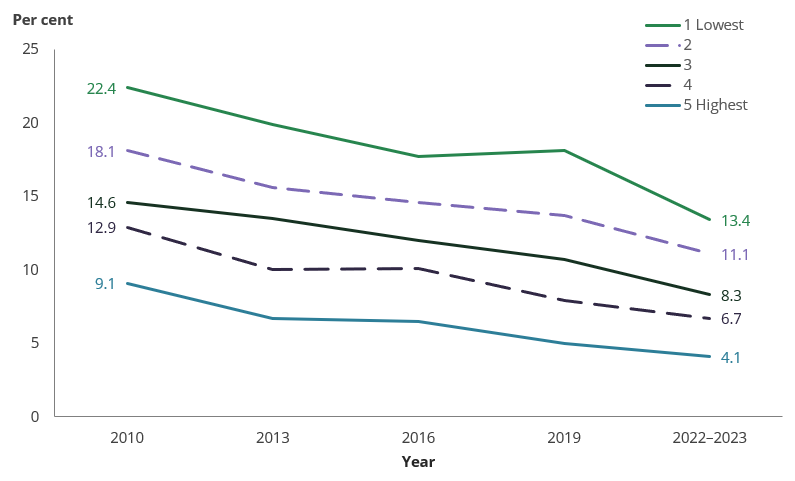
Source: NDSHS 2022–2023, Table 9a.14.
The higher the level of socioeconomic disadvantage, the more likely people were to smoke (Figure 1). People in the lowest socioeconomic areas were about 3.3 times as likely to smoke daily as people in the highest socioeconomic areas in 2022–2023 (13.4% compared with 4.1%).
Daily use of e‑cigarettes is highest in areas of most socioeconomic advantage, and rising
Compared with 2019, the proportion of people who used electronic cigarettes or vapes (‘e‑cigarettes’) daily increased in all socioeconomic areas (Figure 3). This includes both e‑cigarettes with nicotine and those without nicotine.
In 2019, daily use of e‑cigarettes was stable across socioeconomic areas, ranging from 0.8% to 1.3%. However, in 2022–2023, people living in the highest socioeconomic areas were the most likely to use e‑cigarettes daily (4.1%), while those living in the lowest socioeconomic areas were the least likely (2.8%).
When compared with the lowest socioeconomic areas, people living in the highest socioeconomic areas were also:
- 1.5 times as likely to currently be using e‑cigarettes (8.7% compared with 5.8%).
- 1.1 times as likely to have used e‑cigarettes at least once in their lifetime (21% compared with 19.4%).
Figure 3: Daily use of e‑cigarettes by socioeconomic area, people aged 14 and over, 2016 to 2022–2023
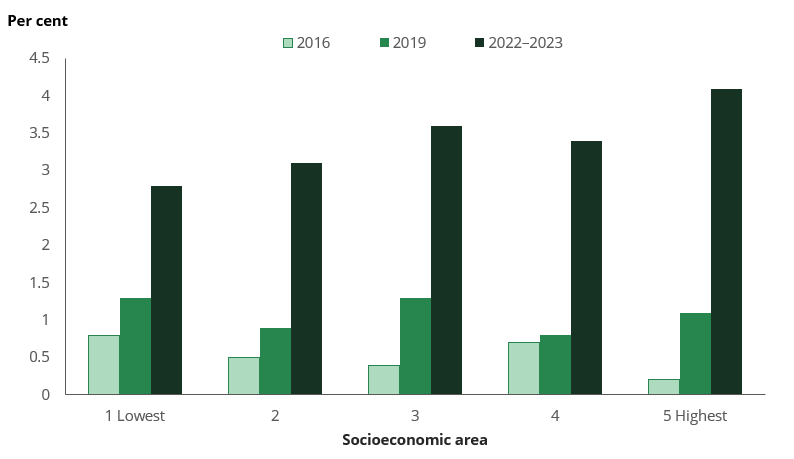
Source: NDSHS 2022–2023, Table 3.11.
Risky drinking is lowest in the lowest socioeconomic areas, and stable
Overall, the proportion of people drinking alcohol at risky levels remained steady between 2019 and 2022–2023 in all socioeconomic areas. There was no change in the proportion of people consuming more than 4 standard drinks on a single day at least once a month, or consuming more than 10 standard drinks per week on average.
People living in the lowest socioeconomic areas were the least likely to drink at risky levels (27%, Figure 1). Differences were small between other socioeconomic areas, ranging from 30% to 32%.
Recent use of illicit drugs is highest in the most advantaged socioeconomic areas, and rising
In most socioeconomic areas, the proportion of people who had recently used illicit drugs remained stable between 2019 and 2022–2023. However, use in the highest socioeconomic areas increased from 18.1% in 2019 to 21% in 2022–2023. Use also increased in the third highest socioeconomic areas, from 15.3% to 18.2% (Figure 4).
People living in the highest socioeconomic areas were more likely to have used illicit drugs recently (21%) than people in other socioeconomic areas (Figure 4).
Figure 4: Recent use1 of illicit drugs by socioeconomic area, people aged 14 and over, 2007 to 2022–2023
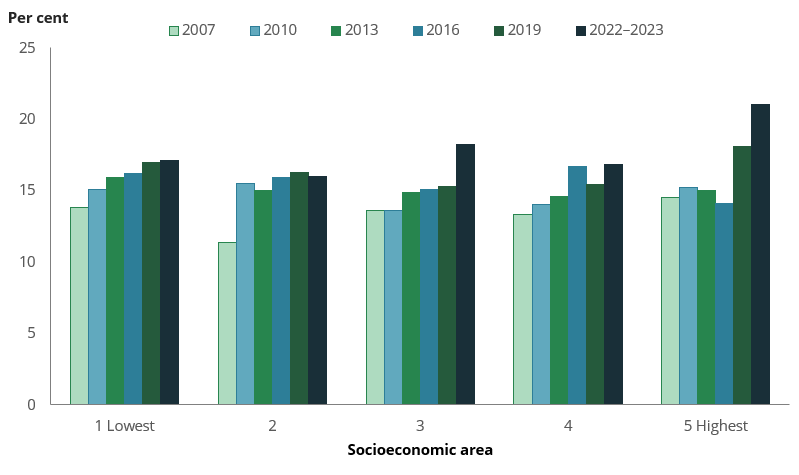
- Used at least 1 of 17 classes of illicit drugs in the previous 12 months in 2022–2023. The number and type of illicit drug has changed over time.
Source: NDSHS 2022–2023, Table 5.13.
While people in the most advantaged socioeconomic areas were 1.2 times as likely as those in the most disadvantaged areas to have recently used illicit drugs (Figure 5), differences varied by drug type:
- People living in the highest socioeconomic areas were 6.1 times as likely to have recently used hallucinogens as those living in the lowest areas (4.3% compared with 0.7%). This was due to an increase in the use of hallucinogens in the highest areas between 2019 (2.1%) and 2022–2023 (4.3%).
- People living in the highest socioeconomic areas were 3.9 times as likely to have recently used cocaine as those living in the lowest areas (7.4% compared with 1.9%).
- People living in the highest socioeconomic areas were 2.8 times as likely to have recently used inhalants as those living in the lowest areas (2.5% compared with *0.9%).
- People living in the highest socioeconomic areas were 2.7 times as likely to have recently used pharmaceutical stimulants for non‑medical purposes as those living in the lowest areas (3.5% compared with 1.3%).
- People living in the lowest socioeconomic areas were 1.6 times as likely to have recently used pain-relievers and opioids for non‑medical purposes as those living in the highest areas (2.8% compared with 1.7%).
* Estimate has a relative standard error of 25% to 50% and should be interpreted with caution.
Figure 5: Recent1 use of selected illicit drugs by socioeconomic area, people aged 14 and over, 2022–2023
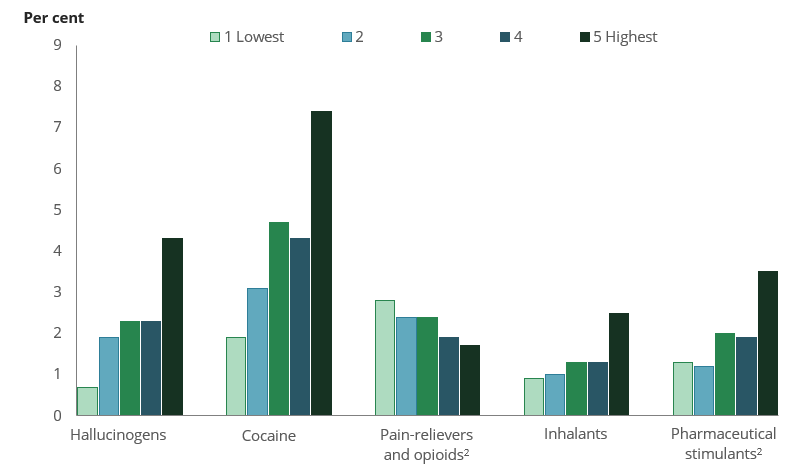
- Used in the previous 12 months.
- Used for non-medical purposes.
Source: NDSHS 2022–2023, Table 9a.14.