First Nations young people in detention
On this page:
- Key findings
- Overview
- How many First Nations young people were in detention?
- Trends in detention by Indigenous status
- How old were First Nations young people?
- Were First Nations females more likely to be in detention compared with non-Indigenous?
- Were First Nations males more likely to be in detention compared with non-Indigenous?
- Were First Nations young people more likely to be in sentenced or unsentenced detention?
- What are the differences by state/territory?
Key findings
- On an average night in the June quarter 2023:
- about 3 in 5 (63%) young people aged 10–17 in detention were First Nations, while First Nations people in this age group make up 5.7% of the general population
- of First Nations young people aged 10–17, 29 per 10,000 were in detention
- First Nations young people aged 10–17 were 29 times as likely as non-Indigenous young people aged 10–17 to be in detention.
- On an average night over the 4-year period from June quarter 2019 to June quarter 2023:
- the rate and number of First Nations young people aged 10–17 in detention have been increasing since the September quarter 2020
- the number of non-Indigenous young people aged 10–17 in detention has been decreasing since the September quarter 2020. The rate has also been decreasing since the June quarter 2021.
Overview
The Australian Institute of Health and Welfare (AIHW) uses 'First Nations people' to refer to Aboriginal and Torres Strait Islander people in this report.
First Nations young people are over-represented in the youth justice system. The over-representation of this population must be understood alongside the broader historic, political and social context of First Nations people and their experiences of colonialism.
For more information see First Nations young people.
How many First Nations young people were in detention?
On an average night in the June quarter 2023:
- there were 478 First nations young people in detention, of which 436 were aged 10–17
- First Nations young people made up more than half (59%) of all those in detention aged 10 and over (Supplementary tables S1 and S11) while non-Indigenous young people made up 41% (336)
- 29 per 10,000 young First Nations people and 1.0 per 10,000 young non-Indigenous people aged 10–17 were in detention
- First Nations young people aged 10–17 were 29 times as likely as non‑Indigenous young people aged 10–17 to be in detention (Supplementary table S10).
Trends in detention by Indigenous status
Between an average night in the June quarter 2019 and the June quarter 2023:
- the number of First Nations young people aged 10 and over in detention has been increasing since the September quarter 2020. Before this, the number had been decreasing
- 46%–59% of young people aged 10 and over in detention were First Nations (Supplementary tables S1 and S11)
- the rate of First Nations young people aged 10–17 in detention has fluctuated between a high of 31 per 10,000 in the June quarter 2019 and March quarter 2023 and a low in the September quarter 2020 (19 per 10,000), and has consistently been higher than the non-Indigenous rate (Figure 2.1)
- the rate of non-Indigenous young people aged 10–17 in detention has remained relatively steady, ranging from 1.0 to 1.4 per 10,000 with an overall downward trend (Figure 2.1)
- in the June quarter 2023, First Nations young people were 29 times as likely to be in detention than non-Indigenous young people. The rate ratio of First Nations to non-Indigenous young people in detention has fluctuated, with a low of 16 in September 2020 and a high of 29 in the March and June quarters 2023 (Supplementary table S18).
Figure 2.1: Young people in detention on an average night, by Indigenous status, June quarter 2019 to June quarter 2023 (number and rate)
The number and rate of First Nations young people in detention has increased between 2020 and 2023 while for non-Indigenous young people the number and rate has decreased.
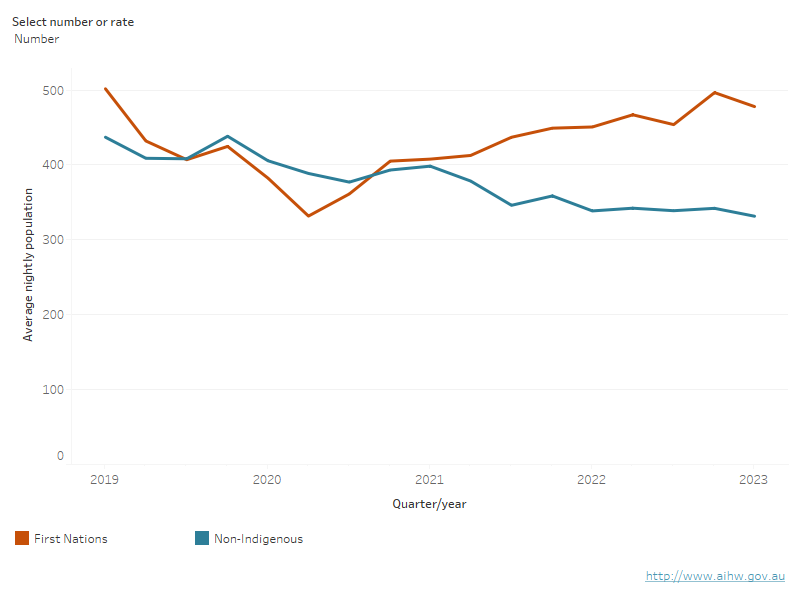
Notes
- Trend data may differ from those previously published due to data revisions.
- Rates are the number of young people per 10,000 relevant population.
- Data for the figure presenting numbers includes young people aged 10 and over; data for the rate figure includes young people aged 10–17.
Source: Supplementary tables S1, S6 and S18.
How old were First Nations young people in detention?
First Nations young people experience detention at relatively younger ages than non-Indigenous young people, with a higher number, rate, and rate ratio for those aged 10–13 and 14–17. Conversely, fewer First Nations young people in detention were aged 18 or over (Figure 2.2).
Nationally, on an average night in the June quarter 2023, for young people aged 10–13 in detention:
- 30 in 41 (or 73%) were First Nations
- 4.0 per 10,000 were First Nations compared to 0.1 per 10,000 who were non-Indigenous (Supplementary table S16).
First Nations young people aged 10–13 were 46 times as likely as non-Indigenous young people to be in detention. The rate ratio for this age group fell from 52 times as likely in the June quarter 2019, when 5.4 per 10,000 First Nations young people were in detention on an average night (Supplementary table S16).
For young people aged 14–17 in detention:
- 406 in 648 (or 63%) were First Nations
- the rate of detention (55 per 10,000) was markedly higher for First Nations than the rate for non-Indigenous young people (2.0 per 10,000) (Supplementary table S17).
First Nations young people aged 14–17 were 28 times as likely as non‑Indigenous young people to be in detention in the June quarter 2023 (Supplementary table S17).
For young people aged 18 and over in detention, 1 in 3 (42 or 34%) were First Nations.
Of First Nations young people in detention on an average night in the June quarter 2023:
- 6.3% were aged 10–13, compared to 3.3% of non-Indigenous young people (Supplementary tables S1, S2, S6 and S7)
- 85% were aged 14–17, compared to 72% of non-Indigenous young people (Supplementary tables S1, S3, S6 and S8)
- 8.8% were aged 18 and over, compared to 24% of non-Indigenous young people (Supplementary tables S1, S5, S6 and S10).
Figure 2.2: First Nations and non-Indigenous people in detention, by age group, June quarter 2019 to June quarter 2023 (number)
Since 2019, the number of First Nations young people in detention was higher across all ages than non-Indigenous, except for the 18+ age group.

Source: Supplementary tables S2, S3, S5, S7, S8, and S10.
On an average night over the 4-year period from the June quarter 2019 to June quarter 2023:
- for those aged 10–13:
- the number of First Nations young people fell from 40 to 30, while for non-Indigenous young people the number ranged between 6 and 12 (Figure 2.2)
- the rate of First Nations young people in detention ranged between 3.0 and 5.4 per 10,000, while for non-Indigenous the rate remained at 0.1 per 10,000 (Supplementary table S16)
- for those aged 14–17:
- the number of First Nations young people in detention ranged from 259 to 427, while for non-Indigenous young people the number ranged between 240 and 319 (Figure 2.2)
- the rate of First Nations young people in detention ranged from 37 to 58 in 10,000, while for non-Indigenous the rate was 2.0 to 2.9 in 10,000 (Supplementary table S17)
- for those aged 18 and over the number of First Nations young people in detention ranged from 28 to 66. For non-Indigenous young people the number ranged from 77 to 116 (Figure 2.2).
Were First Nations females more likely to be in detention compared with non-Indigenous?
The proportion of young people in detention who were female was higher among First Nations young people than among those who were non-Indigenous across all age groups. The difference was greater for those aged 10–13 than for those aged 14–17 or 18 and over.
On an average night in the June quarter 2023, the proportion of First Nations young people in detention who were female and aged:
- 10–13 was higher (13%, or 4 in 30) than the proportion of non-Indigenous young people who were female (6.9%, or less than 1 young non-Indigenous female on an average night)
- 14–17 was higher (13%, or 52 of 406) than the proportion of non-Indigenous young people who were female (8.4%, or 20 of 240)
- 18 or over who were female was higher (8.2% or 3 of 42) than for non-Indigenous females aged 18 or over (5.8% or 5 of 81)
- proportions for young people aged 10–17 were very similar to those aged 14–17 (Supplementary tables S4 and S9).
Were First Nations males more likely to be in detention compared with non-Indigenous?
On an average night in the June quarter 2023, the proportion of First Nations who were male and aged:
- 10–13 in detention was 87% (26 of 30) compared to 93% (or 10 of 11) for non-Indigenous males (Supplementary tables S2 and S7)
- 14–17 in detention was 87% (or 353 of 406) compared to 92% (or 220 of 240) for non-Indigenous males (Supplementary tables S3 and S8)
- 18 and over was 92% (or 39 of 42) for First Nations males and 94% (or 76 of 81) for non-Indigenous males (Supplementary tables S5 and S10).
Were First Nations young people more likely to be in sentenced or unsentenced detention?
Northern Territory youth detention data for legal status are unavailable for the June quarter 2023, so March quarter 2023 data are used for national reporting.
On an average night in the March quarter 2023:
- 81% of First Nations young people in detention were unsentenced; 72% of non-Indigenous young people in detention were unsentenced
- of all young people in unsentenced detention, 3 in 5 (62% or 401) were First Nations
- First Nations young people made up half (50% or 96) of all young people in sentenced detention (Supplementary tables S1, S19, S29, S37 and S47).
On an average night over the 4-year period (June quarter 2019 to March quarter 2023), for those in unsentenced detention:
- there was an increase in the number of First Nations young people from 323 (64%) to 401 (81%) (Figure 2.3)
- the rate of First Nations young people aged 10–17 has been increasing since the September quarter 2020. The rate was at its lowest in the September quarter 2020 at 14 per 10,000 and highest in the March quarter 2023 at 26 per 10,000 young people (Supplementary table S36)
- the rate of non‑Indigenous young people aged 10–17 was relatively stable over time ranging from 0.8 to 1.1 per 10,000 (Supplementary table S36).
On an average night over the 4-year period (June quarter 2019 – March quarter 2023), for those in sentenced detention:
- the number of First Nations young people fell from 178 (36%) in the June quarter 2019 to 96 (19%) in the March quarter 2023 (Supplementary table S37)
- the rate of First Nations young people aged 10–17 fell from 9.4 to 5.2 per 10,000. The rate was at its lowest in the September quarter 2020 and the March quarter 2023 at 5.2 per 10,000 (Supplementary table S54, Figure 2.3)
- The rate of non-Indigenous young people aged 10–17 gradually declined from 0.4 per 10,000 in the June quarter 2019 to 0.2 per 10,000 in the March quarter 2023 (Supplementary table S54, Figure 2.3).
Figure 2.3: First Nations young people in detention, by legal status, June quarter 2019 to March quarter 2023/ June quarter 2023 (number, rate and rate ratio)
The rate and number of First Nations young people in unsentenced detention increased between 2020 and 2023, while the rate of those in sentenced detention decreased.
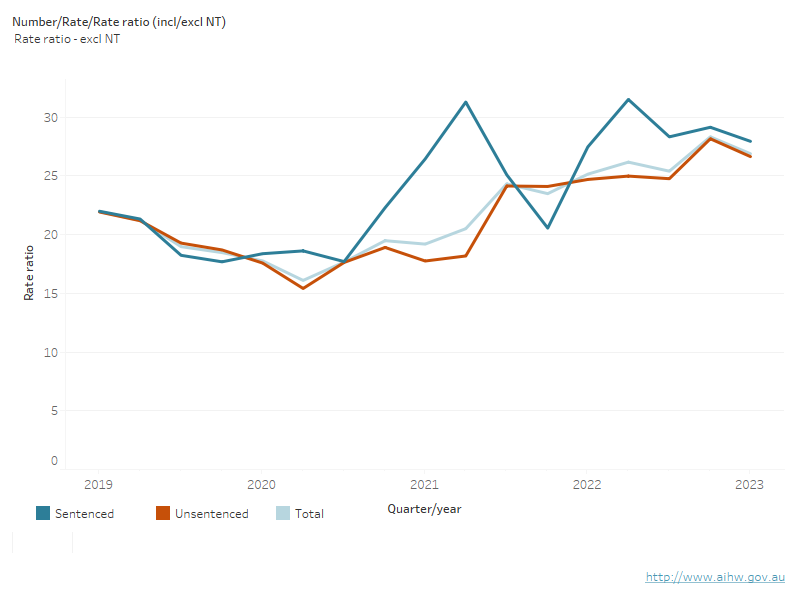
Notes
- Data for the figures presenting numbers includes those young people aged 10 and over, data for the rate and rate ratio figures includes young people aged 10–17.
- Figures presenting data excluding the Northern Territory, exclude Northern Territory data for the entire 4-year period.
- Figures that present data excluding the Northern Territory include the June quarter 2023. For those that include data for the Northern Territory, the June quarter 2023 is excluded.
- Northern Territory data for legal status is unavailable for the June quarter 2023.
- Trend data may differ from those previously published due to data revisions.
- Rates are the number of young people per 10,000 relevant population.
- Rate ratio is calculated by dividing the First Nations rate by the non-Indigenous rate.
Source: Supplementary tables S18, S36, S24.
What are the differences by state/territory?
On an average night in the June quarter 2023, First Nations young people aged 10–17 were more likely to be in detention than non-Indigenous young people across all states and territories. Of the states and territories:
- the Northern Territory and Queensland had the highest rates of First Nations young people aged 10–17 in detention (50 and 45 per 10,000, respectively)
- Victoria had the lowest rate (7.7 per 10,000) of First Nations young people aged 10–17 in detention
- the rate of detention for non-Indigenous young people was highest in the Australian Capital Territory and Tasmania (2.1 and 2.4 per 10,000).
Among the states and territories for which rate ratios could be calculated, the rate ratio for First Nations young people aged 10–17 in detention ranged from 10 times the non-Indigenous rate in Victoria to 30 times in Western Australia (Figure 2.4).
Rates were not calculated due to small numbers for First Nations young people aged 10–17 in Tasmania and the Australian Capital Territory, and for non-Indigenous young people aged 10–17 in the Northern Territory.
On an average night over the 4-year period (June quarter 2019 – June quarter 2023) the rate of First Nations young people aged 10–17 in detention:
- increased in the Northern Territory (from 22 to 50 per 10,000) and Queensland (from 42 to 45 per 10,000)
- fell in Western Australia (from 57 to 30 per 10,000), Victoria (from 19 to 7.7 per 10,000) and South Australia (from 24 to 20 per 10,000).
The rate of non-Indigenous young people aged 10–17 in detention:
- increased in Queensland (from 1.2 to 1.6 per 10,000) and the Australian Capital Territory (1.4 to 2.1 per 10,000)
- fell in New South Wales (from 1.5 to 0.7 per 10,000), Victoria (from 1.8 to 0.9 per 10,000) and South Australia (from 1.1 to 0.9 per 10,000).
The rate ratio has been consistently lowest in Victoria, at 5–11 times the non-Indigenous rate. The rate ratio has been consistently highest in Western Australia, ranging from a high of 58 times the non-Indigenous rate in June 2022 to a low of 30 in June 2023 (Figure 2.4).
Figure 2.4: First Nations young people in detention, by state and territory, June quarter 2019 to June quarter 2023 (number, rate and rate ratio)
Queensland had the highest number of First Nations young people in detention between 2019 and 2023. The rate was highest in Western Australia, Queensland and the Northern Territory.
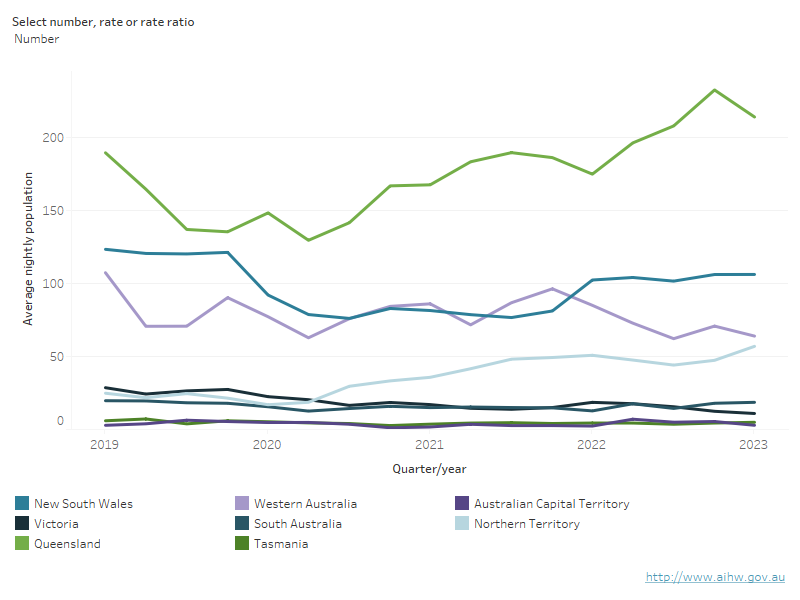
Notes
- Trend data may differ from those previously published due to data revisions.
- For data extracted from the YJ NMDS, age is calculated at the start of the relevant quarter unless the period of detention began within the quarter or the young person had a birthday, in which case age is calculated as at the start of that period or from their birthday.
- Northern Territory data may be affected by legislation implemented in May 2021 which led to key changes in youth justice processes.
- Rates are the number of young people per 10,000 relevant population.
- Rates are not published where there were fewer than 5 young people.
- Trends among small populations should be interpreted with caution. Numbers tend to fluctuate from quarter to quarter due to random variation, and this might affect the appearance and interpretation of trends.
- Rate ratio is calculated by dividing the First Nations rate by the non-Indigenous rate.
- Blank observations in the rate ratio figure are due to unpublished rates. Where there were fewer than 5 young people, rates and rate ratios are not calculated. There might be instances when a numerator is presented as 5, and the rate is not calculated due to rounding (see Technical notes).
- Rate ratios for most quarters are not available for Tasmania, the Australian Capital Territory and the Northern Territory due to small numbers.
Source: Supplementary tables S11 and S18.