State and territory trends
On this page:
Key findings
On an average night in the June quarter 2023:
- the number of young people aged 10 and over in detention was lowest in the Australian Capital Territory (15) and highest in Queensland (306)
- the rate of young people aged 10–17 was highest in the Northern Territory (22 per 10,000) and lowest in Victoria (1.0 per 10,000).
On an average night from the June quarter 2019 to the June quarter 2023:
- the Northern Territory consistently had the highest rate of young people aged 10–17 in detention (6.6–22 per 10,000)
- the rate of young people in detention increased in Queensland (4.4 to 4.9 per 10,000) and the Northern Territory (9.7 to 22 per 10,000) and declined in New South Wales, Victoria, Western Australia, and South Australia.
Overview
The size of youth justice populations in states and territories can be affected by the population size of that state or territory, as well as by differences in state legislation, policies and practices, including the available types of supervised orders and options for diversion. For more information see Youth justice in Australia 2021–22 – Appendices 2–4.
How many young people were in youth detention by state and territory?
On an average night in the June quarter 2023:
- Queensland had the highest number of young people in detention (306), followed by New South Wales (186) and Western Australia (96)
- the Northern Territory had the highest rate of young people aged 10–17 in detention (22 per 10,000), followed by Queensland (4.9 per 10,000) and Western Australia (2.9 per 10,000)
- the Australian Capital Territory had the lowest number of young people aged 10 and over in detention (15), followed by Tasmania (17) and South Australia (34)
- Victoria had the lowest rate of young people aged 10–17 in detention (1.0 per 10,000), followed by New South Wales and South Australia (1.8 per 10,000 for each) (Figure 4.1).
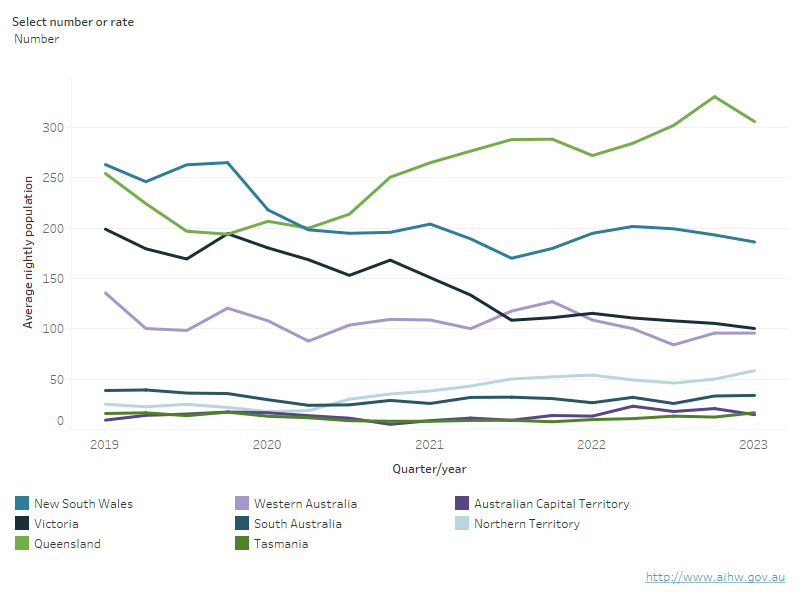
Figure 4.1: Young people in detention on an average night, by state and territory, June quarter 2019–2023 (number and rate)
The rate of young people in detention on an average night has increased for the Northern Territory and remains much higher than for other states and territories.
Notes
- Rates are for young people aged 10–17. Numbers include young people aged 10 or over who are under youth justice supervision. For numbers of young people aged 10–17 only, refer to the supplementary tables.
- Trends among small populations should be interpreted with caution. Numbers tend to fluctuate from quarter to quarter due to random variation, and this might affect the appearance and interpretation of trends.
- Rates are calculated from the unrounded average nightly populations and are not published when there are fewer than 5 young people in the numerator. There might be instances when a numerator is presented as 5 due to rounding, and the rate is not calculated (see Technical notes).
- Numbers might not add up to the total due to rounding.
- Rates for some quarters in the Australian Capital Territory are suppressed due to small numbers.
Source: Supplementary tables S11, S18, S29, S36, S47 and S54.
Changes in the rate of young people in detention over the last 4 years, in each state and territory
On an average night over the 4-year period from the June quarter 2019 to June quarter 2023:
- overall, the Northern Territory had the highest rate of young people aged 10–17 in detention on an average night each quarter (6.6 to 22 per 10,000). The rate peaked in the June quarter 2023 after falling to its lowest in the June quarter 2020
- the rate of young people in detention increased in Queensland (4.4 to 4.9 per 10,000) and the Northern Territory (9.7 to 22 per 10,000) and declined in New South Wales, Victoria, Western Australia and South Australia
- rates of young people in detention have fluctuated in the Australian Capital Territory, increasing from 1.9 to 2.7 per 10,000 over the 2 years from the June quarter 2021
- rates of young people in detention decreased in Tasmania over the 2 years to June 2021 (from 3.1 to 1.2 per 10,000) but increased to 2.8 per 10,000 over the next 2 years
- the states with the highest number of young people aged 10 and over in detention were Queensland (194 to 331) and New South Wales (170 to 265), followed by Victoria (100 to 199) and Western Australia (84–136)
- since the September quarter 2020, Queensland has had the largest number of young people in detention on an average night
- the size of the youth detention population fell in New South Wales, Victoria, Western Australia, and South Australia (Figure 4.2).
What were the differences between states and territories by legal status?
Northern Territory detention data for legal status were unavailable for the June quarter 2023, so the March quarter 2023 data were used for national reporting.
On an average night in the March quarter 2023, the rate of young people aged 10–17:
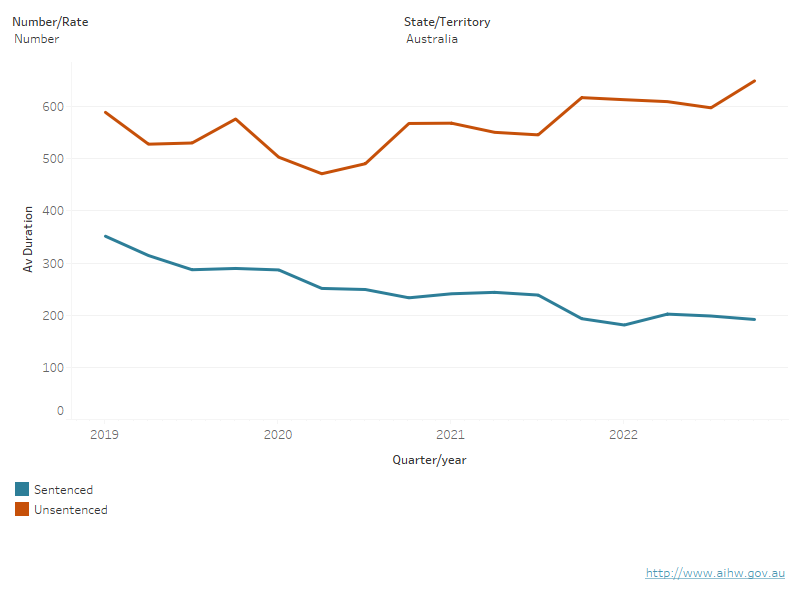
- in unsentenced detention ranged from 1.0 per 10,000 in Victoria to 16 per 10,000 in the Northern Territory
- in sentenced detention ranged from 0.1 per 10,000 in Victoria to 2.7 per 10,000 in Northern Territory (among the states and territories for which data is available) (Figure 4.2).
Over the 4-year period (from June quarter 2019 to March quarter 2023), the rate of young people aged 10–17 in unsentenced detention:
- increased sharply in the Northern Territory from the September quarter 2020 to the March quarter 2023 (3.1 to 16 per 10,000, respectively)
- increased in Queensland from a low of 2.8 per 10,000 in the December quarter 2019 to 4.9 per 10,000 in the March quarter 2023
- declined in New South Wales from 1.8 to 1.5 per 10,000 with a low in the December quarter 2021 of 1.1 per 10,000.
Trends in unsentenced detention could not be reliably determined in Tasmania and the Australian Capital Territory due to small numbers.
Over the same 4-year period, the rate of young people aged 10–17 in sentenced detention fell overall in New South Wales (0.9 to 0.4 per 10,000), Victoria (0.5 to 0.1 per 10,000), Queensland (0.8 to 0.4 per 10,000), Western Australia (1.8 to 0.9 per 10,000), and the Northern Territory (6.7 to 2.7 per 10,000).
Trends could not be reliably determined in South Australia, Tasmania and the Australian Capital Territory due to small numbers (Figure 4.2).
Figure 4.2: Young people in detention on an average night, by legal status, by state and territory, June quarter 2019–2023 (number and rate)
The rate of young people in sentenced detention decreased between 2019 and 2023, while that for unsentenced detention has increased since 2020.
Notes
- Numbers might not add up to the total due to rounding.
- Rates are for young people aged 10–17. Numbers include young people aged 10 and over who are under youth justice supervision. For numbers of young people aged 10–17 only, refer to the supplementary tables.
- Trends among small populations should be interpreted with caution. Numbers tend to fluctuate from quarter to quarter due to random variation, and this might affect the appearance and interpretation of trends.
- Rates are calculated from the unrounded average nightly populations, and are not published when there are fewer than 5 young people in the numerator. There might be instances where a numerator is presented as 5 due to rounding, and the rate is not calculated (see Technical notes).
- Rates for some quarters for South Australia, Tasmania and the Australian Capital Territory are suppressed due to small numbers.
- Legal status data for the Northern Territory was unavailable for the June quarter 2023, so March quarter 2023 data is used in presentations that include Northern Territory data.
Source: Supplementary tables S29, S36, S47 and S54.