Comparisons over time
Changes in burden over time from specific diseases or injuries may be due to changes in population size, population ageing, changes in disease prevalence (including epidemics) or changes to how causes are reported or coded in health data.
For fatal burden (YLL) estimates, notable changes in cause of death coding practices occurred over time for dementia and accidental poisoning. For non-fatal burden (YLD) estimates, morbidity data were drawn from a wide variety of sources, with varying availability and data quality over time. Of note, changes in testing practices and diagnostic criteria occurred over time for gestational diabetes. Therefore, comparisons over time for some causes need to be interpreted with caution.
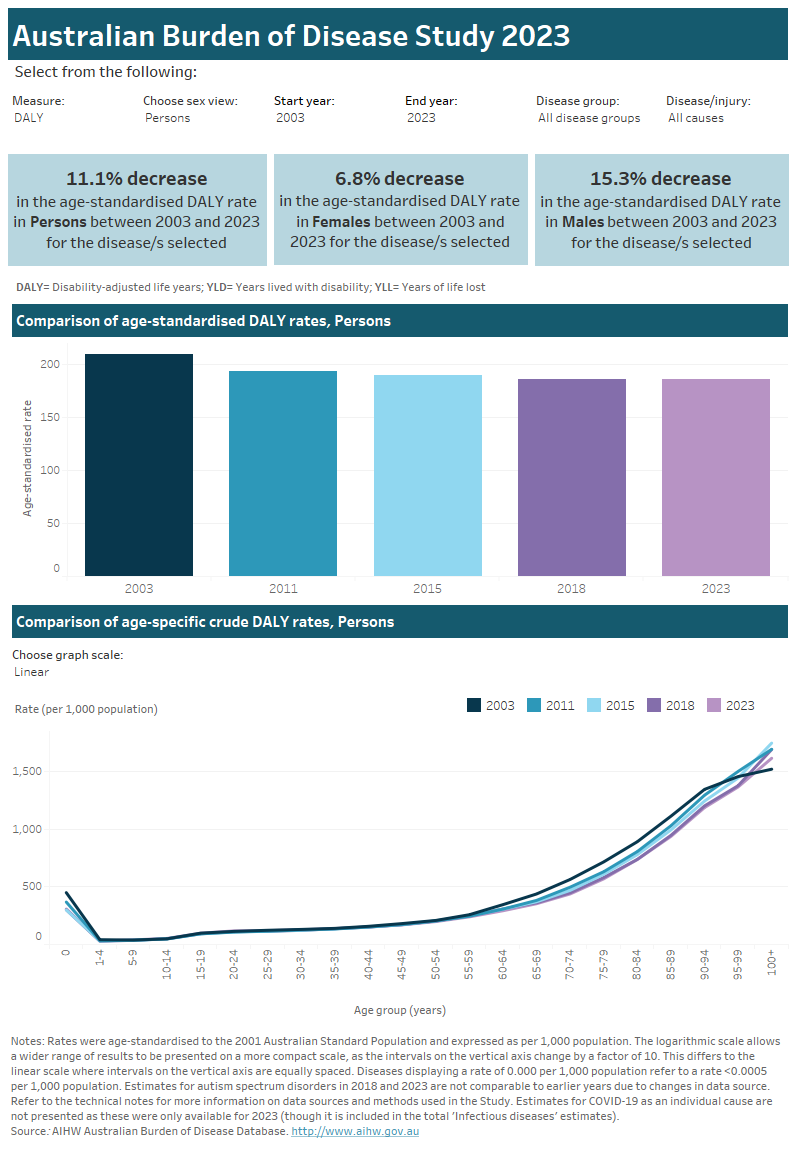
Use the interactive graphs to explore differences in age-standardised and age-specific rates of burden (DALY, YLD or YLL) in Australia. Estimates are displayed by sex and for disease groups or by specific disease or injury for the most recent year (2023) and for years 2003, 2011, 2015 and 2018 for comparison. Estimates for COVID‑19 as an individual cause are not presented as these were only available for 2023 (though it is included in the total ‘Infectious diseases’ estimates).
Use the drop-down lists at the top of the visualisation to filter the data by measure of burden, sex, start and end year, disease group and disease/injury.

Hover over the bars or lines on the charts for additional information.
The toolbar at the bottom of the visualisation enables users to interact with the data in different ways:

Undo = Undo the latest filter applied.
Redo = Redo the latest filter applied.
Revert = Clears all filters applied and reverts visualisation to defaults filters.
Refresh = Connects to the underlying data source and updates the visualisation with any changes in the data (not applicable to this visualisation).
Pause = Stops the visualisation from updating each time a filter is changed, enabling multiple filters to be changed at once. Clicking ‘Resume’ will update the visualisation according to the selected filters.
Share = Generates a link that can be shared (note that filters will not be applied when link is shared).
Download = Allows a downloadable file as either an image (PNG), PDF or PowerPoint file. This is a useful way to save a snapshot of the visualisation to include in a document or presentation.
Full screen = Displays the dashboard in full screen mode (press Esc to return to original view).
Figure 3.3: Comparisons of disease burden in Australia over time
This interactive visualisation compares disease burden in Australia over time for each data year (2003, 2011, 2015, 2018 and 2023), by type of burden, sex, disease group and disease.