Leading causes of disease burden
Ranking diseases by burden shows the leading causes of health loss in Australia. Changes in rankings over time may be due to changes in disease prevalence (including epidemics) or changes to how causes of data are collected, reported or coded.
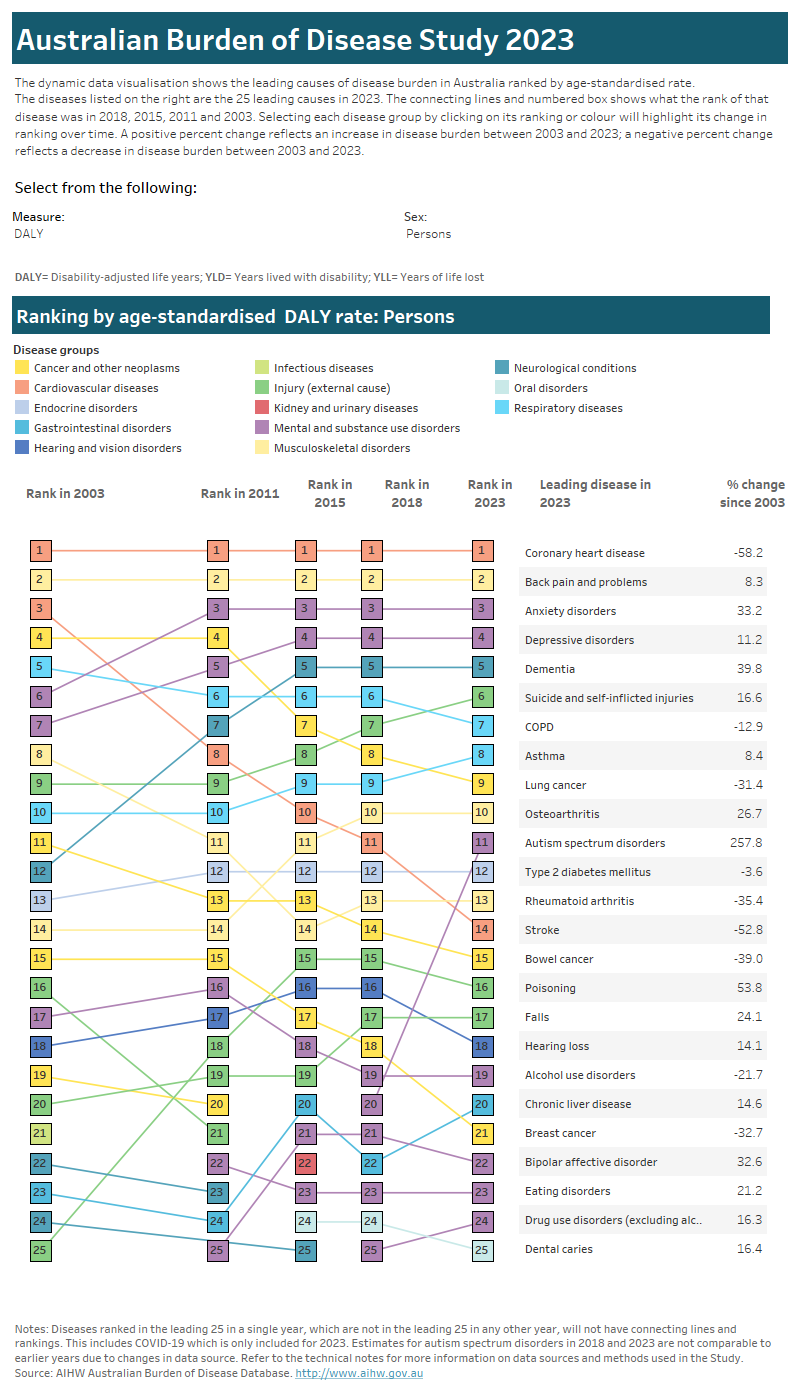
This visualisation shows the leading 25 causes of disease burden (YLL, YLD or DALY) in Australia in 2023 compared with previous years (2003, 2011, 2015 and 2018) ranked by:
- age-standardised rate (ASR) of disease burden, which takes into account differences in population age structure and size between years. This graph can be filtered by sex.
- the number of YLL, YLD or DALY. This graph can be filtered by sex and/or age group.
Note that rankings are a relative measure and changes in rank over time do not always mean the disease or injury has increased or decreased in the population. Leading causes of YLL are based on Australian Burden of Disease Study 2023 methods and will not be comparable to leading causes of death reported elsewhere due to modelling and cause of death alignment to diseases. Further, estimates for COVID‑19 have no ranking in previous years which were prior to the pandemic (2003, 2011, 2015 and 2018). For a discussion of results related to leading causes of burden, refer to the Key findings.
Click on the tabs at the top of the visualisation to either view the disease rankings by age-standardised rate of burden or by number of burden.

Use the drop-down lists to filter the data by measure of burden, sex and age group (for Rank by number only).

Hover over the coloured squares or lines on the charts for additional information.
The toolbar at the bottom of the visualisation enables users to interact with the data in different ways:

Undo = Undo the latest filter applied.
Redo = Redo the latest filter applied.
Revert = Clears all filters applied and reverts visualisation to default filters.
Refresh = Connects to the underlying data source and updates the visualisation with any changes in the data (not applicable to this visualisation).
Pause = Stops the visualisation from updating each time a filter is changed, enabling multiple filters to be changed at once. Clicking ‘Resume’ will update the visualisation according to the selected filters.
Share = Generates a link that can be shared (note that filters will not be applied when link is shared).
Download = Allows a downloadable file as either an image (PNG), PDF or PowerPoint file. This is a useful way to save a snapshot of the visualisation to include in a document or presentation.
Full screen = Displays the dashboard in full screen mode (press Esc to return to original view).
Figure 3.4: Leading causes of disease burden in Australia
This interactive visualisation compares changes over time in Australia’s leading cause of burden rankings by age-standardised rate and burden amount.