Personal life
Parenting responsibilities
In 2021, over 1 in 2 (57%) people with disability aged 35–44 had parenting responsibilities.
Having children
In 2021, 3 in 10 (29%) people with disability aged 35–44 said they do not have children and are unlikely (or unsure) to have any in the future.
Life satisfaction
In 2021, half (52%) of people with disability aged 15–64 were highly satisfied with their life (42% of those with severe or profound disability).
On this page:
Introduction
People with disability are more likely than those without disability to experience social isolation, loneliness and lower levels of satisfaction with their local community (see ‘Social inclusion and community support’). This section covers aspects of personal life of people with disability such as family background, parenting responsibilities and satisfaction with life in general.
Data note
Data on this page are sourced from the 2021 Household, Income and Labour Dynamics in Australia (HILDA) Survey. For more information about HILDA, including the concepts of disability, disability severity, disability groups, and remoteness categories used by the HILDA Survey, see ‘Data sources’.
Moving out of the parental home
Moving out of the parental home is an important step towards adulthood in a young person's life. The age when people moved out of their parental home for the first time varies by age group:
- Nearly two-thirds (63%) of people with disability aged 18–24 are still living in their parental home, which is similar to those without disability (69%).
- Of those aged 25–44 with disability, most say they moved out of home before the age of 25 (70%) and 16% are still living at home (compared with 74% and 9.4%, respectively, of those without disability) (DSS and MIAESR 2022).
Family planning and parenting responsibilities
The proportion of people with parenting responsibilities among those aged 15–64 varies by age group, sex, disability status and disability group:
- People with disability aged 25–34 are about as likely (33%) to have parenting responsibilities for children aged under 18 as those without disability (34%). The proportions of people with and without disability who have parenting responsibilities are also similar for the 15–24 age group (4.0% for people with disability and 3.0% for those without) and the 55–64 age group (9.6% and 9.8%, respectively).
- People with disability aged 35–44 and 45–54 are less likely (57% and 42%, respectively) than those without disability (74% and 53%, respectively) to have parenting responsibilities.
- Overall, people with disability are similarly likely to have parenting responsibilities whether they are male or female (26% of males and 30% of females aged 15–64 have parenting responsibilities). However, among people with disability aged 25‑34, women (40%) are more likely to have parenting responsibilities than men (25%).
- People with physical disability are more likely to have parenting responsibilities (31%) than those with sensory or speech (22%) or intellectual disability (13%) (DSS and MIAESR 2022).
People with disability aged 15–44 are more likely to not have children or say they are unlikely to have children in the future than people without disability:
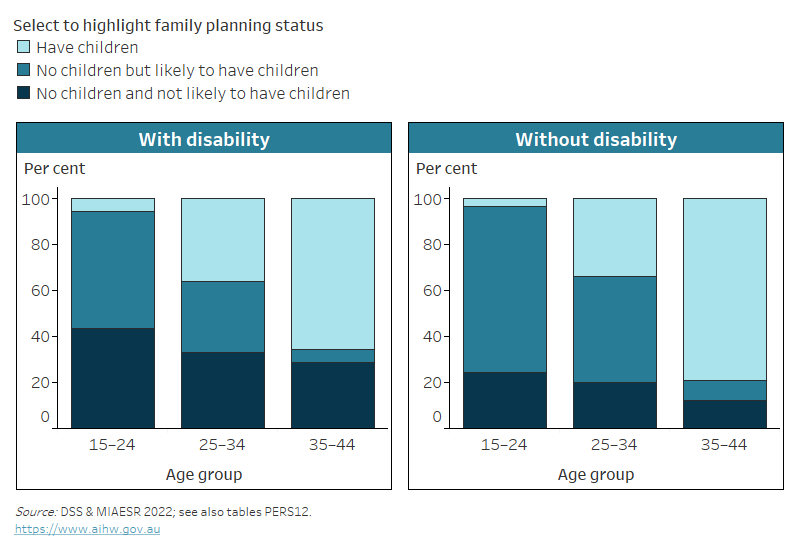
- One in 3 (34%) people with disability aged 15–44 never had children and say they are unlikely (unsure) to have any in the future, compared with 18% of people without disability. This was the case for all age sub-groups (Figure PERSONAL.1).
- Over one-third (36%) of males and 32% of females aged 15–44 with disability do not have children and say they are unlikely (unsure) to have any in the future.
- Half (51%) of people with severe or profound disability do not have children and say they are unlikely (unsure) to have any in the future, compared with 32% of people with other disability status.
- 57% of people with intellectual disability do not have children and say they are unlikely (unsure) to have any in the future, compared with 40% of those with psychosocial disability, and 30% of those with physical disability (DSS and MIAESR 2022).
Figure PERSONAL.1: Family status and intentions to have children, by disability status and age group, 2021
The chart shows that proportion of people without children and who are unlikely to have children is higher for people with disability than without.
Notes:
* Relative standard error of 25–50% and should be used with caution.
- Restricted to people aged 15–44.
- ‘Have children’ includes people who have one or more children.
- ‘No children but likely to have children’ includes people who never had a child, but say they are likely to have a child in the future.
- ‘No children and not likely to have children’ includes people who never had a child and are unlikely (unsure) to have a child in the future.
Source data tables: Data tables – Personal life. View data tables
Satisfaction with the amount of free time
Satisfaction with aspects of life
Each year, the HILDA Survey participants are asked to rate their satisfaction with 8 aspects of their life on a 0–10 scale (10 represents the highest level of satisfaction and 0 the lowest):
- the home in which they live
- their employment opportunities
- their financial situation
- how safe they feel
- feeling part of their local community
- their health
- the neighbourhood in which they live
- the amount of free time they have.
After assessing their satisfaction with each of the above aspects, respondents are then asked how satisfied they are with their life, all things considered.
This chapter looks at satisfaction with the amount of free time and the overall life satisfaction. For information on satisfaction with other aspects of life see ‘Health’, ‘Social support’, ‘Housing’, ‘Employment’, and ‘Income and finance’.
In this analysis, people who indicated a satisfaction level between 0 and 5 are referred to as not satisfied, and those with level between 6 and 10 as satisfied; 6 or 7 is considered somewhat satisfied and 8 to 10 highly satisfied.
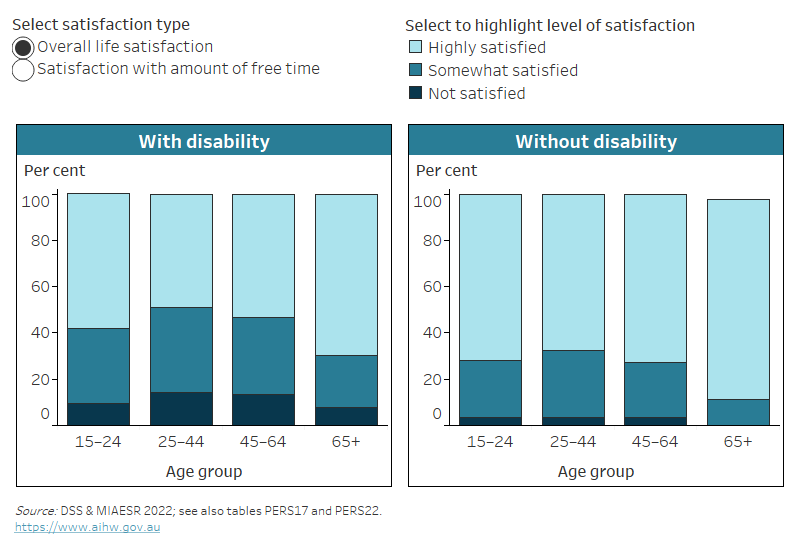
The satisfaction with the amount of free time people have varies largely by age group. In general, satisfaction with the amount of free time is lowest for people aged 25–44 and highest for people aged 65 and over (Figure PERSONAL.2).
People with disability aged 15–24 are less likely to be satisfied with the amount of free time they have than those without disability (73% compared with 84%), as are people aged 65 and over (91% for those with disability, compared with 95% for those without) (Figure PERSONAL.2).
Of people with disability aged 15–64:
- males are more likely (50%) to be highly satisfied with the amount of free time they have than females (41%)
- those with severe or profound disability are more likely (52%) to be highly satisfied than those with other disability status (44%)
- those living in Major cities are less likely (43%) to be highly satisfied than those in Inner regional areas (50%)
- those with intellectual disability are more likely (56%) to be highly satisfied than those with physical disability or psychosocial disability (both 44%) (DSS and MIAESR 2022).
Figure PERSONAL.2: Overall life satisfaction and satisfaction with amount of free time for people aged 15 and over, by disability status and age group, 2021
The chart shows people with disability have similar satisfaction with free time, but lower life satisfaction, compared with people without disability.
Notes:
- Satisfaction is collected on an ordinal scale from 0 (totally dissatisfied) to 10 (totally satisfied).
- ‘Highly satisfied’ includes category 8, 9 and 10 (totally satisfied). ‘Somewhat satisfied’ includes category 6 and 7. ‘Not satisfied’ includes category 0 (totally dissatisfied) to 5 (neither satisfied nor dissatisfied).
- The estimated proportion of those ‘Not satisfied’ with life overall for people aged 65 and over without disability has a relative standard error greater than 50% and is considered too unreliable for general use. Therefore, it is not shown in this figure.
Source data tables: Data tables – Personal life. View data tables
Life satisfaction
About half (52%) of people with disability aged 15–64 are highly satisfied with their life, all things considered. This is lower than for people without disability, of whom 70% are highly satisfied. People aged 65 and over with disability are more likely to be highly satisfied with their life (70%) than those with disability aged 15–64, but less likely than those aged 65 and over without disability (86%) (Figure PERSONAL.2).
Of people aged 15–64 with disability:
- females are as likely (52%) to be highly satisfied with their life as males (53%)
- those with severe or profound disability are less likely to be highly satisfied (42%) than people with other disability status (54%) (DSS and MIAESR 2022).
How has COVID-19 affected people's lives?
About 6 in 10 (58%) people with disability aged 15 and over said in 2021 that their life changed significantly (to a great or moderate extent) because of the Coronavirus crisis. This was lower than for people without disability, of whom 64% reported significant changes to their life because of COVID-19.
Among people with disability, those aged 15–64 were slightly more likely to report significant changes to their life because of COVID-19 than those aged 65 and over (60%, compared with 55%). Females aged 15–64 were slightly more likely than males to report significant changes (62%, compared with 58%) (DSS and MIAESR 2022).
DSS (Department of Social Services) and MIAESR (Melbourne Institute of Applied Economic Social Research) (2022) The Household, Income and Labour Dynamics in Australia (HILDA) Survey, General Release 21 (wave 21), doi:10.26193/KXNEBO, ADA Dataverse, V3, AIHW analysis of unit record data, accessed 7 December 2022.
Summerfield M, Garrard B, Kamath R, Macalalad N, Nesa MK, Watson N, Wilkins R, Wooden M (2022) HILDA User Manual – Release 21, Melbourne Institute: Applied Economic and Social Research, University of Melbourne, accessed 26 April 2023.
Watson N, Nesa MK and Summerfield M (2022) HILDA Project Discussion Paper Series: Wave 21 data quality, Melbourne Institute: Applied Economic and Social Research, University of Melbourne, accessed 24 May 2023.
Wilkins R, Vera-Toscano E, and Botha F (2024) The Household, Income and Labour Dynamics in Australia Survey: Selected Findings from Waves 1 to 21, Melbourne Institute: Applied Economic and Social Research, University of Melbourne, accessed 27 February 2024.