Clients with disability
On this page
People with disability are a diverse group, with varying types and severities of disability across all socioeconomic and demographic groups (AIHW 2020). Their pathways into and out of homelessness are just as varied, and can be influenced by disability type, location and the severity of their disability (Beer et al. 2019). People with disability may have a greater exposure to risk factors associated with homelessness than the general population (Beer et al. 2012). Low income, lack of social support, limited engagement with the labour market, compounded by the need for specialised assistance and services, can leave some people with disability increasingly vulnerable to the risk of homelessness and the negative impact of homelessness.
Timely access to safe, suitable and long-term housing can be critical to the wellbeing of people with disability. Affordable and secure housing can provide independence and the ability to participate in social, economic, sporting and cultural life. Housing that meets accessibility standards, is in close proximity to transport and to quality and affordable support services is also vital for those with disability (COAG 2011). The consequences of inadequate support may be severe for both those with physical and/or intellectual disabilities (Beer et al. 2012).
In 2018, an estimated 1 in 5 Australians (4.4 million people, or 18% of the total population) had disability (ABS 2019), ranging from mild to severe disabilities. Similar to 2006 and 2011, the 2016 Census identified around 5,700 people experiencing homelessness with disability in Australia (defined as people with a need for assistance with core activities) (ABS 2018). People with disability represented 5% of those experiencing homelessness on Census night in 2016.
Reporting clients with disability in the Specialist Homelessness Services Collection (SHSC)
Disability is a challenging concept to measure and there are numerous definitions. The SHSC disability questions are based on identifying whether the client has any difficulty and/or need for assistance with 3 core activities (self care, mobility and communication). These questions are asked of all SHS clients.
Data for clients with disability who required assistance may not be comparable across age groups due to differences in the interpretation of the SHSC disability questions. This issue mainly relates to young children, and therefore any comparisons between age groups should be made with caution.
Further details about measuring disability in the SHSC and the definition of a client with severe or profound core activity limitation are provided in Technical information.
Key findings
- In 2019–20, 6,700 (2%) SHS clients reported a severe or profound core activity limitation (throughout this section termed those with severe or profound disability).
- Over half (55%) of clients with severe or profound disability were housed but at risk of homelessness when they sought SHS assistance; the other 45% were experiencing homelessness.
- Almost 2 in 3 clients with disability in 2019–20 (65%) had previously been assisted by a SHS agency at any time since the collection began in 2011–12, the remaining 35% were deemed to be new clients.
- Most clients with severe or profound disability (with closed support) ended SHS support housed (70% or 2,700 clients); with many in private or other housing (1,500 or 38%).
Client characteristics
In 2019–20 (Table DIS.1):
- 6,700 SHS clients always or sometimes needed assistance with core activities (self care, communication and/or mobility). These clients are described as having severe or profound core activity limitation(s), or as living with disability.
- SHS clients with severe or profound disability represented 2% of all SHS clients in 2019–20, similar to 2018–19 (also 2%) but down from 3% in 2017–18.
|
|
2015–16 |
2016–17 |
2017–18 |
2018–19 |
2019–20 |
|---|---|---|---|---|---|
|
Number of clients |
9,812 |
10,988 |
7,902 |
7,198 |
6,717 |
|
Proportion of all clients |
4 |
4 |
3 |
2 |
2 |
|
Rate (per 10,000 population) |
4.1 |
4.5 |
3.2 |
2.9 |
2.6 |
Notes:
- Rates are crude rates based on the Australian estimated resident population (ERP) at 30 June of the reference year. Minor adjustments in rates may occur between publications reflecting revision of the estimated resident population by the Australian Bureau of Statistics.
- Data for 2015–16 to 2016-17 have been adjusted for non-response. Due to improvements in the rates of agency participation and SLK validity, data from 2017–18 are not weighted. The removal of weighting does not constitute a break in time series and weighted data from 2015–16 to 2016-17 are comparable with unweighted data for 2017–18 onwards. For further information, please refer to the Technical notes.
Source: Specialist Homelessness Services Collection 2015–16 to 2019-20.
Age and sex
In 2019–20, of the 6,700 clients with severe or profound disability (Supplementary table DIS.1):
- Clients were generally younger than the total SHS population, that is,
- 40% (2,700 clients) were under 25 years; most of these younger people were less than 10 years (1,500 clients)
- 42% (2,800) were aged 25 to 54
- 18% (1,200) were aged 55 or over.
- There were similar proportions of male (50% or 3,400 clients) and female (50% or 3,300) SHS clients with severe or profound disability.
In 2019–20, of the 2,700 SHS clients under 25 years living with severe or profound disability there was a higher proportion of males (58%) compared with females (42%). For those aged 25 and over, there was a greater proportion of female (54%) than males (46%).
Indigenous clients
In 2019–20, of the 6,400 SHS clients with severe or profound disability who provided information about their Aboriginal and/or Torres Strait Islander status (Supplementary table DIS.8):
- 24% were Indigenous (1,600 clients), lower than the total SHS population (27%).
- There were equal numbers of Indigenous male and female clients (800 each), but differences based on age; a higher proportion of males were aged under 25 years (56%) compared with females (40%).
Indigenous clients with disability had a younger age profile than non-Indigenous clients with disability. Thirty-seven per cent of Indigenous clients with disability were aged under 18 compared with 28% of non-Indigenous clients.
State and territory
In 2019–20 (Supplementary table DIS.2):
- Four in 10 (41% or 2,800 clients) SHS clients with severe or profound disability accessed SHS services in Victoria, 24% (more than 1,600 clients) in New South Wales and 12% (almost 800 clients) in Queensland.
- The Northern Territory had the highest rate of SHS clients with severe or profound disability (9 clients per 10,000 population), up from 7 clients per 10,000 in 2018–19. Both South Australia and Victoria had 4 clients per 10,000 in 2019–20, the rate in South Australia reduced from 6 clients per 10,000 in 2018–19.
Living arrangements and presenting unit type
In 2019–20, of the 6,700 clients with severe or profound disability, the most common living arrangement reported at the beginning of SHS support was living alone (38% or almost 2,500 clients) (Supplementary table DIS.10). The next most common living arrangement was one parent with child/ren (27% or 1,800) and then other family (14% or over 900 clients). These proportions have been similar over time.
The majority of clients with severe or profound disability presented alone (61% or 4,100 clients) to a SHS agency in 2019–20 (Supplementary table DIS.9).
Selected vulnerabilities
Living with disability may not be the only challenge faced by this group of SHS clients. In 2019–20, 73% (or 3,800) of clients with severe or profound disability (aged 10 and over) reported experiencing one or more selected vulnerabilities: a current mental health issue, problematic drug and/or alcohol use or family and domestic violence (Table DIS.2). The remaining 27% (or 1,400 clients) did not report any of the selected vulnerabilities.
In 2019–20:
- 3 in 10 (30% or 1,500) clients with disability reported experiencing a current mental health issue only
- 14% (more than 700) experienced a current mental health issue and family and domestic violence
- a further 7% (more than 300 clients) of clients experienced all 3 vulnerabilities.
|
Family and domestic violence |
Mental health issue |
Problematic drug and |
Clients |
Per cent |
|---|---|---|---|---|
|
Yes |
Yes |
Yes |
336 |
6.5 |
|
Yes |
Yes |
No |
737 |
14.3 |
|
Yes |
No |
Yes |
24 |
0.5 |
|
No |
Yes |
Yes |
581 |
11.2 |
|
Yes |
No |
No |
427 |
8.3 |
|
No |
Yes |
No |
1,541 |
29.8 |
|
No |
No |
Yes |
106 |
2.1 |
|
No |
No |
No |
1,417 |
27.4 |
|
|
|
|
5,169 |
100.0 |
Notes
1. Clients are assigned to one category only based on their vulnerability profile.
2. Clients are aged 10 and over.
3. Totals may not sum due to rounding.
Source: Specialist Homelessness Services Collection 2019–20.
Housing situation on first presentation
At the beginning of the first support period almost half (45%) of all clients with disability presented to services experiencing homelessness, while 55% were at risk of homelessness (where homeless status was known) (Supplementary table CLIENTS.12).
The National Disability Insurance Scheme (NDIS)
The National Disability Insurance Scheme (NDIS) supports people with a permanent and significant disability which affects their ability to take part in everyday activities. It is jointly governed and funded by the Australian and participating states and territory governments. The NDIS began its national rollout on 1 July 2016, it is expected to be fully implemented by July 2020 (DPS 2019). Further details about the NDIS are provided in Technical information.
NDIS participation indicator
The NDIS participation indicator was introduced into the Specialist Homelessness Services Collection (SHSC) from 1 July 2019. A participant in the NDIS is an individual who is receiving an agreed package of support through the National Disability Insurance Scheme. The NDIS question is asked of all clients at the start of support from a SHS agency. Data are not available for clients who only had support period(s) starting before 1 July 2019.
National Disability Insurance Scheme (NDIS) participants
A person can be identified as being a SHS client with severe or profound disability but not be a participant in the NDIS. This may be because the client did not meet the NDIS eligibility criteria, has not applied for the NDIS or has a pending application or does not live in an area where the NDIS is available. These clients may still be receiving disability support under the National Disability Agreement (NDA). For further information regarding the number of SHS clients receiving support through the NDIS see Clients, services and outcomes.
Service use patterns
In 2019–20, clients with profound or severe disability:
- received a median of 86 days of support, double the general SHS population (median 43 days) (Table DIS.1 and Table CLIENT.3). This may reflect the more complex needs of these clients
- were more likely to receive accommodation (36%) than the general SHS population (30%), and for those who did, the length of supported accommodation was much longer (median 57 nights compared with 28 nights for the general SHS population)
- were less likely to receive accommodation over time; in 2019–20, 36% received accommodation, down from 39% in 2015–16. This is still higher than the total SHS population (30%).
|
|
2015–16 |
2016–17 |
2017–18 |
2018–19 |
2019–20 |
|---|---|---|---|---|---|
|
Length of support (median number of days) |
64 |
65 |
76 |
80 |
86 |
|
Average number of support periods per client |
2.3 |
2.3 |
2.5 |
2.4 |
2.4 |
|
Proportion receiving accommodation |
39 |
39 |
38 |
36 |
36 |
|
Median number of nights accommodated |
55 |
50 |
58 |
50 |
57 |
Notes:
- The denominator for the proportion receiving accommodation is all SHS clients with disability. Denominator values for proportions are provided in the relevant supplementary table.
- Data for 2015–16 to 2016–17 have been adjusted for non-response. Due to improvements in the rates of agency participation and SLK validity, data from 2017–18 are not weighted. The removal of weighting does not constitute a break in time series and weighted data from 2015–16 to 2016-17 are comparable with unweighted data for 2017-18 onwards. For further information, please refer to the technical notes.
Source: Specialist Homelessness Services Collection 2015-16 to 2019-20.
New or returning clients
The episodic or cyclic nature of homelessness can be explored by analysing whether clients with severe or profound disability were new to SHS agencies, or returning clients. In 2019–20, 65% (4,300 clients) of clients with severe or profound disability had also received SHS assistance at some time since the collection began in 2011–12 (Supplementary table DIS.7). The other 35% (2,400 clients) were new clients, that is, they first accessed services in 2019–20.
Main reasons for seeking assistance
In 2019–20, for SHS clients with severe or profound disability (Supplementary tables DIS.5 and DIS.6):
- The most common main reason for seeking SHS assistance was housing crisis (25% or 1,700 clients). This was most common for both clients experiencing homelessness (30% or almost 900 clients) and at risk of homelessness (22% or almost 800 clients).
- Family and domestic violence was the second most common main reason (18% or 1,200 clients), more so for clients at risk of homelessness (19% or 700 clients) than clients experiencing homelessness (14% or 400 clients).
- Inadequate or inappropriate dwellings conditions was the next most common main reason (14% or 900 clients), with 17% of homeless (almost 500 clients) and 12% of at risk clients reporting this as a main reason (400 clients).
Services needed and provided
Four of the top 6 reasons clients with profound or severe disability sought SHS assistance were housing-related and the other 2 were financial reasons (Figure DIS.1). Of clients with disability in 2019–20:
- Almost half needed long-term housing (47% or more than 3,100 clients), which is accommodation for 3 months or more. More than one in 20 clients (6% or 200 clients) with severe or profound disability received the long-term housing they needed. An additional 32% (almost 1,000 clients) received a referral.
- 43% (2,900 clients) needed assistance to sustain tenancy or prevent tenancy failure or eviction and this service was provided to most (84% or around 2,400) of clients with that need.
- 42% (2,800 clients) needed short-term or emergency accommodation, and it was provided to more than half (62% or 1,700 clients) with that need.
- 37% (almost 2,500 clients) needed medium-term/transitional housing and it was provided to one-third (31% or almost 800 clients) with that need.
Of the financial reasons for seeking SHS assistance:
- Material aid/brokerage was needed by 43% of clients (2,900 clients), and provided to 86% of those with that need.
- Financial information was needed by 30% of clients (2,000 clients) and provided to 84% of clients with that need.
Figure DIS.1: Clients with disability, by most needed services and service provision status (top 6), 2019–20
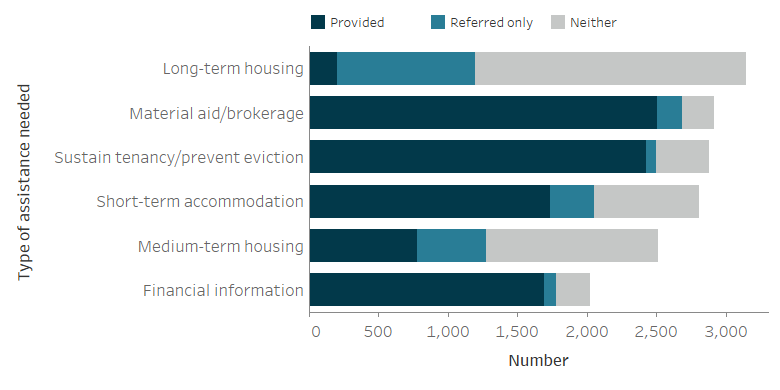
Notes
- Excludes 'Other basic assistance', 'Advice/information' and 'Advocacy/liaison on behalf of client'.
- 'Short-term accommodation' includes temporary and emergency accommodation and sustain tenancy/prevent eviction includes assistance to sustain tenancy or prevent tenancy failure or eviction.
- 'Neither' indicates a service was neither provided nor referred.
Source: Specialist Homelessness Services Collection 2019–20, Supplementary table DIS.3.
Other services that were needed by clients with severe or profound disability included:
- 1 in 5 clients (20% or 1,300) needed health/medical services and 79% (or over 1,000) of clients with these identified needs either received the services or were referred elsewhere for services.
- Clients with severe or profound disability were more likely to need transport (27% or almost 1,800 clients), assistance with challenging social/behavioural problems (20%) and assistance for trauma (16%) than the general SHS population (18%, 12% and 13% respectively).
The proportion of SHS clients with disability with a case management plan has increased over time (77% in 2019–20); however those achieving all case management goals has remained low (14% in 2019–20) (Supplementary table CLIENTS.35).
Outcomes at the end of support
Outcomes presented here highlight the changes in clients’ housing situation between the start and end of support. Data is limited to clients who ceased receiving support during the financial year—meaning that their support periods had closed and they did not have ongoing support at the end of the year.
Many clients had long periods of support or even multiple support periods during 2019–20. They may have had a number of changes in their housing situation over the course of their support. These changes within the year are not reflected in the data presented here, rather the client situation at the start of their first period of support during 2019–20 is compared with the end of their last period of support in 2019–20. A proportion of these clients may have sought assistance prior to 2019–20, and may again in the future.
In 2019–20, key features of the housing situation for clients with disability include (Table DIS.4):
- At the start of SHS support, more clients with disability were at risk of homelessness (almost 2,400 or 58%) than experiencing homelessness (1,700 or 42%). Following SHS support, there were fewer clients with disability experiencing homelessness (1,200 clients or 30%).
- The decrease in the proportion of clients known to be experiencing homelessness was due to the drop in those living in a house, townhouse or flat as a couch surfer (with no tenure) and those living in an improvised/inadequate dwelling (rough sleeping); both down 5 percentage points (from 13% to 8% and 11% to 6% respectively).
- For clients with disability, the greatest change in housing situation from the start to the end of support was for those living in public or community housing; increasing from just over 600 to 1,000 clients (from 16% to 26%).
SHS agencies were able to assist many clients secure or maintain housing, reducing the experience and risk of homelessness among clients with disability.
|
Housing situation |
Beginning of support |
End of |
Beginning of support |
End of |
|---|---|---|---|---|
|
No shelter or improvised/inadequate dwelling |
437 |
218 |
10.6 |
5.6 |
|
Short term temporary accommodation |
767 |
650 |
18.6 |
16.6 |
|
House, townhouse or flat - couch surfer or with no tenure |
545 |
312 |
13.2 |
7.9 |
|
Total homeless |
1,749 |
1,180 |
42.4 |
30.0 |
|
Public or community housing - renter or rent free |
638 |
1,018 |
15.5 |
25.9 |
|
Private or other housing - renter, rent free or owner |
1,439 |
1,485 |
34.9 |
37.8 |
|
Institutional settings |
299 |
244 |
7.2 |
6.2 |
|
Total at risk |
2,376 |
2,747 |
57.6 |
70.0 |
|
Total clients with known housing situation |
4,125 |
3,927 |
100.0 |
100.0 |
|
Not stated/other |
315 |
513 |
|
|
|
Total clients |
4,440 |
4,440 |
|
|
Notes:
1. Percentages have been calculated using total number of clients as the denominator (less not stated/other).
2. It is important to note that individual clients beginning support in one housing type need not necessarily be the same individuals ending support in that housing type.
3. Not stated/other includes those clients whose housing situation at either the beginning or end of support was unknown.
Source: Specialist Homelessness Services Collection. Supplementary table DIS.4.
Housing outcomes for homeless versus at risk clients
For clients with severe or profound disability with a known housing status who were at risk of homelessness at the start of support (more than 2,200 clients), by the end of support (Figure DIS.2):
- Half (around 1,100 clients or 50%) were in private housing
- Around 700 clients (30%) were in public or community housing.
Figure DIS.2: Housing situation for clients with closed support who began support at risk of homelessness, 2019–20
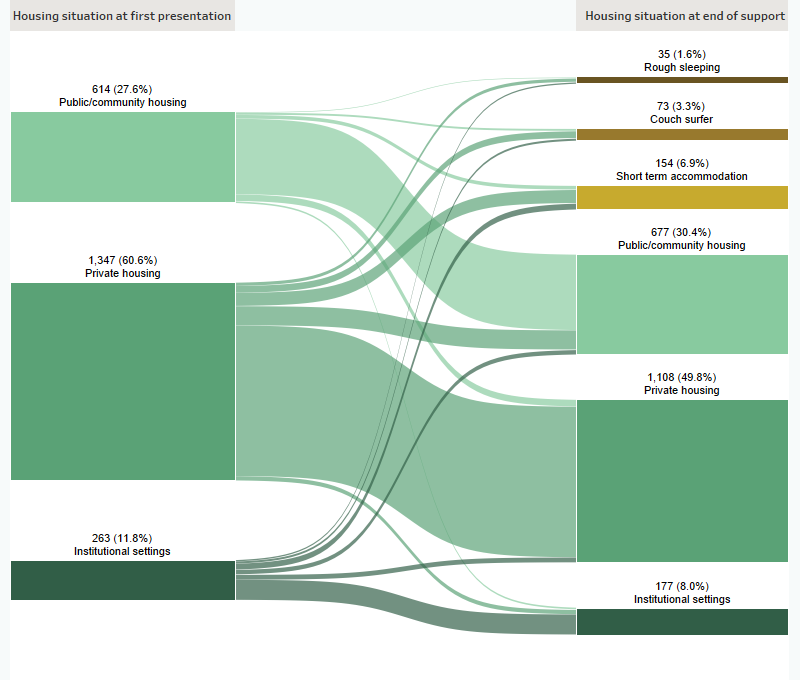
Notes
- Excludes clients with unknown housing situation.
- Includes only those clients who ceased receiving support during the financial year (meaning that their support period(s) had closed and they were not in ongoing support at the end of the year).
Source: Specialist Homelessness Services Collection 2019–20.
For clients who were known to be homeless at the start of support (almost 1,600 clients), agencies were able to assist (Figure DIS.3):
- almost 500 clients (30%) into short term accommodation
- over 300 (21%) into private housing.
Figure DIS.3: Housing situation for clients with closed support who were experiencing homelessness at the start of support, 2019–20
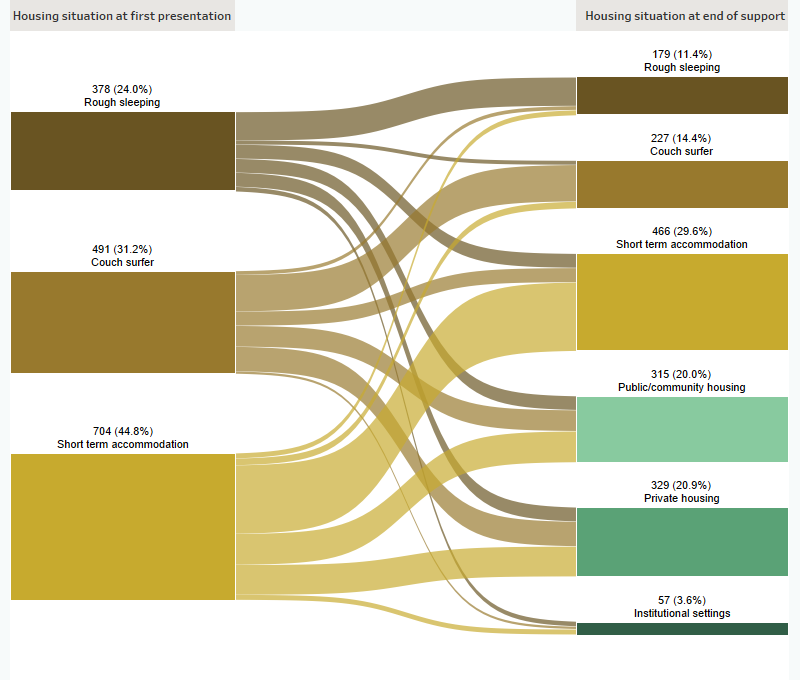
Notes
- Excludes clients with unknown housing situation.
- Includes only those clients who ceased receiving support during the financial year (meaning that their support period(s) had closed and they were not in ongoing support at the end of the year).
Source: Specialist Homelessness Services Collection 2019–20.
For more information on people with disability, see People with disability in Australia, AIHW.
References
ABS (Australian Bureau of Statistics) 2019. Disability, Ageing and Carers, Australia: Summary of Findings, 2018. ABS cat. no. 4430.0. Canberra: ABS.
ABS 2018. Census of population and housing: Estimating homelessness, 2016. ABS cat. no. 2049.0. Canberra: ABS.
AIHW (Australian Institute of Health and Welfare) 2020. People with disability in Australia. Cat. No. DIS 72. Canberra: AIHW.
Beer A, Baker E, Lester L, & Lyrian D 2019. The relative risk of homelessness among persons with a disability: New methods and policy insights. International Journal of Environmental Research and Public Health, vol. 16, issue 22: 1-12
Beer A, Baker E, Mallett S, Batterham D, Pate A, & Lester, L 2012. Addressing homelessness amongst persons with disability: Identifying and enacting best practice. FaHCSIA National Homelessness Research Project. Project 1-EFBLTW. Adelaide: Centre of Housing, Urban and Regional Planning.
Beer A & Faulkner D 2009. The housing careers of people with a disability and carers of people with a disability. Melbourne: Australian Housing and Urban Research Institute
COAG (Council of Australian Governments) 2011. National Disability Strategy 2010–2020. Canberra: Commonwealth of Australia.
DPS (Department of Parliamentary Services) 2019. The National Disability Insurance Scheme: a quick guide. Research paper series, 2018–19. Canberra: Parliamentary Library.