Clients with problematic drug and/or alcohol use
On this page
There is a strong association between problematic alcohol or other drug use and experiences of homelessness (AIHW 2020). Problematic drug and/or alcohol use can be a pathway into homelessness or develop while experiencing homelessness (Robinson 2014; Johnson & Chamberlain 2008). It can lock people into homelessness and compound the effects of limited service engagement and increased social isolation. Problematic alcohol or other drug use is related to several homelessness risk factors, including low socioeconomic status and family and domestic violence (Lalor 2020). The Journeys Home project identified that people were more likely to have risky levels of alcohol and drug use, the longer they were homeless (Scutella et al. 2014).
People with problematic drug and/or alcohol use are at great risk of serious and preventable health issues and death, particularly those who are homeless (AIHW 2020). They are also likely to have the most persistent and challenging problems (Johnson & Chamberlain 2008; Scutella et al. 2014).
Reporting clients with problematic drug and/or alcohol use in the Specialist Homelessness Services Collection (SHSC)
SHS clients aged 10 and over are reported in the SHSC with problematic drug and/or alcohol use if, at the beginning of or during support, the client provided any of the following information:
- recorded their dwelling type as rehabilitation facility
- required drug or alcohol counselling
- were formally referred to the SHS service from an alcohol and drug treatment service
- had been in a rehabilitation facility or institution during the past 12 months
- reported problematic drug, substance or alcohol use as a reason for seeking assistance or the main reason for seeking assistance.
The identification of clients with problematic drug and/or alcohol use may be current or recent; referring to issues at presentation, just prior to receiving support or at least once in the 12 months prior to support.
For more information see Technical information.
Key findings
- In 2019–20, 1 in 10 SHS clients (10%, or almost 28,500 people aged 10 and over) were identified as having problematic drug and/or alcohol use.
- Most clients with problematic drug and/or alcohol use were known to be homeless upon presentation (58%) compared with 43% of all SHS clients.
- Clients with problematic drug and/or alcohol use received more frequent support (3.0 support periods per client) over a longer period (median support length 90 days) than other client groups.
- At the end of support in 2019–20, almost half (47%) of clients with problematic drug and/or alcohol use were known to be experiencing homelessness, which was higher than for all other client groups.
Client characteristics
In 2019–20 (Table SUB.1):
- SHS agencies assisted almost 28,500 clients (aged 10 and over) with problematic drug and/or alcohol use, an increase from almost 26,600 in 2015–16.
- Clients with problematic drug and/or alcohol use represented 10% of all SHS clients.
|
|
2015–16 |
2016–17 |
2017–18 |
2018–19 |
2019–20 |
|---|---|---|---|---|---|
|
Number of clients |
26,562 |
27,229 |
27,158 |
27,974 |
28,459 |
|
Proportion of all clients |
10 |
9 |
9 |
10 |
10 |
|
Rate (per 10,000 population) |
11.2 |
11.3 |
11.0 |
11.2 |
11.2 |
Notes:
- Rates are crude rates based on the Australian estimated resident population (ERP) at 30 June of the reference year. Minor adjustments in rates may occur between publications reflecting revision of the estimated resident population by the Australian Bureau of Statistics.
- Data for 2015–16 to 2016–17 have been adjusted for non-response. Due to improvements in the rates of agency participation and SLK validity, data from 2017–18 are not weighted. The removal of weighting does not constitute a break in time series and weighted data from 2015–16 to 2016–17 are comparable with unweighted data for 2017–18 onwards. For further information, please refer to the Technical Notes.
Source: Specialist Homelessness Services Collection 2015–16 to 2019–20.
Age and sex
In 2019–20, of clients with problematic drug and/or alcohol use (Supplementary table SUB.1):
- More than half (53% or almost 15,000 clients) were male which differed to the overall SHS client profile which was mostly female (60%).
- Clients with problematic drug and/or alcohol use had a younger age profile than other SHS client groups with around 8 in 10 (79%) clients aged under 45 years; 28% were aged 10–24 years, 25% aged 25–34 and 26% aged 35–44.
- Male clients had an older age profile than females, with 53% of males aged 35 and over compared with 41% of females.
Indigenous clients
- In 2019–20, around 8,000 clients with problematic drug and/or alcohol use identified as Indigenous (Supplementary table SUB.8). This equates to 3 in 10 clients (28%) with problematic drug and/or alcohol use whose Indigenous status was known.
- Indigenous clients with problematic drug and/or alcohol use represent 11% of all Indigenous SHS clients (Supplementary table INDIGENOUS.1).
Indigenous clients with problematic drug and/or alcohol use had a younger age profile than non-Indigenous clients with problematic drug and/or alcohol use. That is:
- 30% of Indigenous clients with problematic drug and/or alcohol use were aged 10–24 compared with 27% of non-Indigenous clients, and
- 18% of Indigenous clients with problematic drug and/or alcohol use were aged 45 and over compared with 22% of non-Indigenous SHS clients.
State and territory
In 2019–20:
- The highest number of SHS clients with problematic drug and/or alcohol use accessed services in Victoria (more than 10,500 clients or 37% of national total) and New South Wales (almost 7,700 or 27%) (Supplementary table SUB.2).
- The Northern Territory had the highest rate of clients with problematic drug and/or alcohol use (33.6 per 10,000 population) followed by Tasmania (16.8 per 10,000 population). Queensland had the lowest rate, at 7.7 clients per 10,000 population.
- Services in the Australian Capital Territory and Tasmania had the highest proportion of SHS clients with problematic drug and/or alcohol use (14% each). The Northern Territory (8%) had the lowest proportion of SHS clients reporting problematic drug and/or alcohol use (Supplementary table SUB.2 and CLIENTS.1).
Presenting unit and Living arrangements
Almost 9 in 10 clients with problematic drug and/or alcohol use (87% or almost 24,800) presented to services for assistance alone, higher than for all SHS clients (61%). A further 8% (or more than 2,300) of clients with problematic drug and/or alcohol use presented with one or more children, which is much lower than for all SHS clients (29%).
Similarly, the types of living arrangements reported by SHS clients with problematic drug and/or alcohol use at the beginning of support were quite different from the overall SHS population and other client groups.
In 2019–20 (Supplementary tables SUB.10 and CLIENTS.10):
- Almost 6 in 10 (58% or more than 16,100) clients with problematic drug and/or alcohol use were living alone at the beginning of SHS support. This is higher than the proportion for all SHS clients (30%) and other client groups, such as clients with a current mental health issue (46%) and clients with disability (38%).
- Comparatively fewer clients with problematic drug and/or alcohol use were living as one parent with child(ren) (12% or 3,400 compared with 34% of total SHS clients), or in a group (10% or 2,800 clients compared with 6% of total SHS clients).
Selected vulnerabilities
Most clients with problematic drug and/or alcohol use face additional challenges which may make them more vulnerable to homelessness. The selected additional vulnerabilities presented here include family and domestic violence and/or a current mental health issue.
In 2019–20 (Table SUB.2):
- More than 2 in 5 (44% or more than 12,400) clients with problematic drug and/or alcohol use also reported a current mental health issue.
- Almost 8,700 (31%) clients with problematic drug and/or alcohol use also reported a current mental health issue and family and domestic violence.
|
Family and domestic violence |
Mental health issue |
Problematic drug and |
Clients |
Per cent |
|---|---|---|---|---|
|
Yes |
Yes |
Yes |
8,684 |
30.5 |
|
Yes |
No |
Yes |
2,368 |
8.3 |
|
No |
Yes |
Yes |
12,435 |
43.7 |
|
No |
No |
Yes |
4,972 |
17.5 |
|
|
|
|
28,459 |
100.0 |
Notes
- Clients are assigned to one category only based on their vulnerability profile.
- Clients are aged 10 and over.
- Totals may not sum due to rounding.
Source: Specialist Homelessness Services Collection 2019–20.
Housing situation on first presentation
At the beginning of the first support period, more than half (58%) of all clients with a problematic drug and/or alcohol use were experiencing homelessness when they presented to services for assistance, while 42% were at risk of homelessness (Supplementary table CLIENTS.12).
Service use patterns
Clients with problematic drug and/or alcohol use (see Tables SUB.3) received:
- a median 90 days of support, up from 77 days in 2015–16
- an average of 3.0 support periods per client
|
|
2015–16 |
2016–17 |
2017–18 |
2018–19 |
2019–20 |
|---|---|---|---|---|---|
|
Length of support (median number of days) |
77 |
83 |
86 |
87 |
90 |
|
Average number of support periods per client |
2.9 |
2.9 |
3.0 |
2.9 |
3.0 |
|
Proportion receiving accommodation |
51 |
49 |
50 |
50 |
51 |
|
Median number of nights accommodated |
37 |
40 |
40 |
35 |
35 |
Notes:
- The denominator for the proportion receiving accommodation is all SHS clients who have problematic drug and/or alcohol use. Denominator values for proportions are provided in the relevant supplementary table.
- Data for 2015–16 to 2016–17 have been adjusted for non-response. Due to improvements in the rates of agency participation and SLK validity, data from 2017–18 are not weighted. The removal of weighting does not constitute a break in time series and weighted data from 2015–16 to 2016–17 are comparable with unweighted data for 2017–18 onwards. For further information, please refer to the Technical Notes.
Source: Specialist Homelessness Services Collection 2015–16 to 2019–20.
New or returning clients
In 2019–20 (Supplementary table SUB 7):
- Clients with problematic drug and/or alcohol use were more likely to have received SHS services in the past (75% or almost 21,500 clients) than be new clients (25% or almost 7,000). That is, more clients had previously been assisted by an SHS agency at some point since the collection began in 2011–12.
- Clients with problematic drug and/or alcohol use were more likely to be returning (75%), compared with other client groups, for example 68% of clients with a mental health issue and 65% of those with profound or severe disability. This may reflect the cyclic nature of homelessness for people with problematic drug and/or alcohol use.
Main reasons for seeking assistance
In 2019–20, the main reasons clients with problematic drug and/or alcohol use presented to SHS agencies were:
- housing crisis (19%, compared with 18% of the overall SHS population)
- inadequate/inappropriate dwelling conditions (15%, compared with 11%)
- family and domestic violence (14%, compared with 29%) (Supplementary tables SUB.5 and CLIENTS.21).
Few clients (5%) with problematic drug and/or alcohol use reported substance use issues as the main reason for seeking SHS assistance.
Services needed and provided
In 2019–20, the top 6 needs reported by SHS clients with problematic drug and/or alcohol use mainly related to housing and tenure (Figure SUB.1). Key features include:
- Short-term or emergency accommodation was the most needed service or assistance type (63% or almost 18,000 clients) and it was provided to 67% of these clients. A higher proportion of clients in this group needed this type of short-term housing compared with other groups, such as those with mental health issues (49%) and those with disability (42%).
- Long-term housing (57% or around 16,300 clients) was also commonly needed, but was one of the services that was least able to be provided (4% of these clients).
- Material aid/brokerage was needed by around half of clients (51% or almost 14,500 clients), with assistance provided to the majority (89%) of these clients.
- Unlike other client groups, living skills/personal development (39%) was one of the top 6 needs, and it was provided to 90% of these clients.
In 2019–20, more than one-third (35% or 9,800 clients) of clients with problematic drug and/or alcohol use identified a need for drug or alcohol based services (Supplementary table SUB.3):
- almost half (42% or 4,200 clients) had their request met
- 2,000 clients (21%) were referred to another agency
- 3,600 clients (37%) had unmet needs for drug or alcohol based services (neither provided nor referred).
Figure SUB.1: Clients with problematic drug or alcohol issues, by most needed services and service provision status (top 6), 2019–20
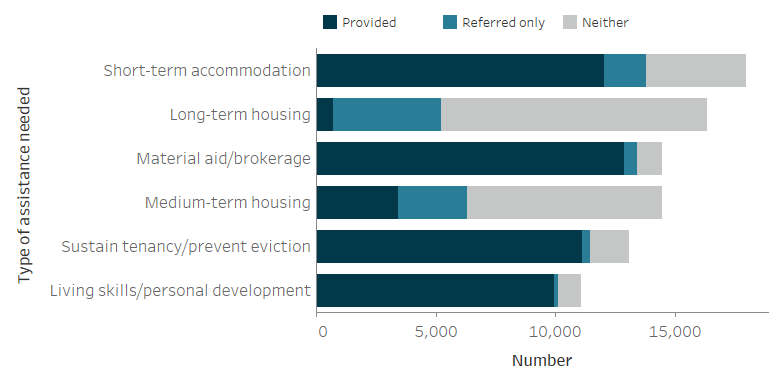
Note:
-
Excludes 'Other basic assistance, 'Advice/information' and 'Advocacy/liaison on behalf of client'.
-
'Short-term accomodation' includes temporary and emergeny accomodation and sustain tenancy/prevent eviction includes asssistance to sustain tenancy or prevent failure or eviction.
-
'Neither' indicates a service was neither provided nor referred.
Source: Specialist Homelessness Services Collection 2019–20, Supplementary table SUB.3.
The proportion of SHS clients with problematic drug and/or alcohol use with a case management plan in 2019–20 was relatively high (74%); however, those achieving all case management goals was low (13%) (Supplementary table CLIENTS.35). This group remains one of the least likely of all SHS client groups to meet all goals.
Outcomes at the end of support
Outcomes presented here highlight the changes in clients’ housing situation between the start and end of support. Data are limited to clients who ceased receiving support during the financial year—meaning that their support periods had closed and they did not have ongoing support at the end of the 2019–20 reporting period.
Many clients had long periods of support or even multiple support periods during 2019–20. They may have had a number of changes in their housing situation over the course of their support. These changes within the year are not reflected in the data presented here, rather the client situation at the start of their first period of support during 2019–20 is compared with the end of their last period of support in 2019–20. A proportion of these clients may have sought assistance prior to 2019–20, and may again in the future.
In 2019–20 (Table SUB.4):
- Over half of clients with problematic drug and/or alcohol use began support known to be experiencing homelessness (57% or 9,800 clients); decreasing by almost 2,400 to 7,400 clients (46%) by the end of support. Compared with all other client groups, these clients were most likely to start and end support known to be experiencing homelessness.
- Much of the decrease in numbers of clients known to be experiencing homelessness can be attributed to the drop in clients sleeping rough (no shelter or improvised/inadequate dwellings); from 3,300 clients at the start to 1,700 at the end of support.
- One of the greatest changes in housing situation from the start to the end of SHS support was for those living in public or community housing; a 8 percentage point increase from around 11% to 19%.
While overall housing outcome figures generally reflect trends towards more favourable housing, experiences of homelessness, particularly rough sleeping, appear to be more common for clients with problematic drug and/or alcohol use both at the start and end of SHS support.
|
Housing situation |
Beginning of support |
End of |
Beginning of support |
End of |
|---|---|---|---|---|
|
No shelter or improvised/inadequate dwelling |
3,321 |
1,692 |
19.5 |
10.7 |
|
Short term temporary accommodation |
3,266 |
3,487 |
19.2 |
22.1 |
|
House, townhouse or flat - couch surfer or with no tenure |
3,169 |
2,225 |
18.6 |
14.1 |
|
Total homeless |
9,756 |
7,404 |
57.4 |
46.9 |
|
Public or community housing - renter or rent free |
1,859 |
2,985 |
10.9 |
18.9 |
|
Private or other housing - renter, rent free or owner |
2,883 |
3,674 |
17.0 |
23.3 |
|
Institutional settings |
2,502 |
1,736 |
14.7 |
11.0 |
|
Total at risk |
7,244 |
8,395 |
42.6 |
53.1 |
|
Total clients with known housing situation |
17,000 |
15,799 |
100.0 |
100.0 |
|
Not stated/other |
1,263 |
2,464 |
|
|
|
Total clients |
18,263 |
18,263 |
|
|
Notes:
- Percentages have been calculated using total number of clients as the denominator (less not stated/other).
- It is important to note that individual clients beginning support in one housing type need not necessarily be the same individuals ending support in that housing type.
- Not stated/other includes those clients whose housing situation at either the beginning or end of support was unknown.
Source: Specialist Homelessness Services Collection. Supplementary table SUB.4.
Housing outcomes for homeless versus at risk clients
For clients with a known housing status who were at risk of homelessness at the start of support (almost 6,600 clients), by the end of support (Figure SUB.2):
- Almost 1 in 3 (2,100 clients or 32%) were in private housing.
- Around 1,800 clients (27%) were in public or community housing.
A smaller number were experiencing homelessness at the end of support (around 1,500 clients or 22% of those who started support at risk).
Figure SUB.2: Housing situation for clients with closed support who began support at risk of homelessness, 2019–20
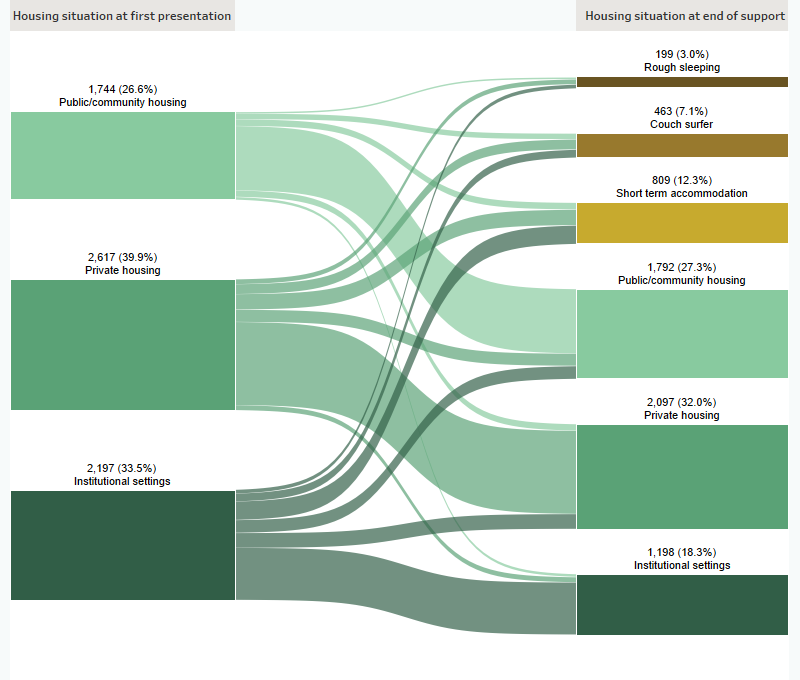
Notes:
- Excludes clients with unknown housing situation.
- Includes only those clients who ceased receiving support during the financial year (meaning that their support period(s) had closed and they were not in ongoing support at the end of the year).
Source: Specialist Homelessness Services Collection, 2019–20
For clients who were known to be homeless at the start of support (just over 8,500 clients), agencies were able to assist (Figure SUB.3):
- 2,500 clients (29%) into short term accommodation
- 1,400 (17%) into private housing.
A further 1,700 clients (20%) were couch surfing at the end of support and 1,400 clients (17%) were rough sleeping at the end of support.
The characteristics of people with problematic drug and/or alcohol use as well as their service use patterns and housing outcomes were different from the other client groups presented in this report. Clients with problematic drug and/or alcohol use were more likely to be male, present to agencies alone and be homeless at first presentation compared with overall SHS clients. They were also more likely to be returning clients and use support services to a greater extent.
Figure SUB.3: Housing situation for clients with closed support who were experiencing homelessness at the start of support, 2019–20
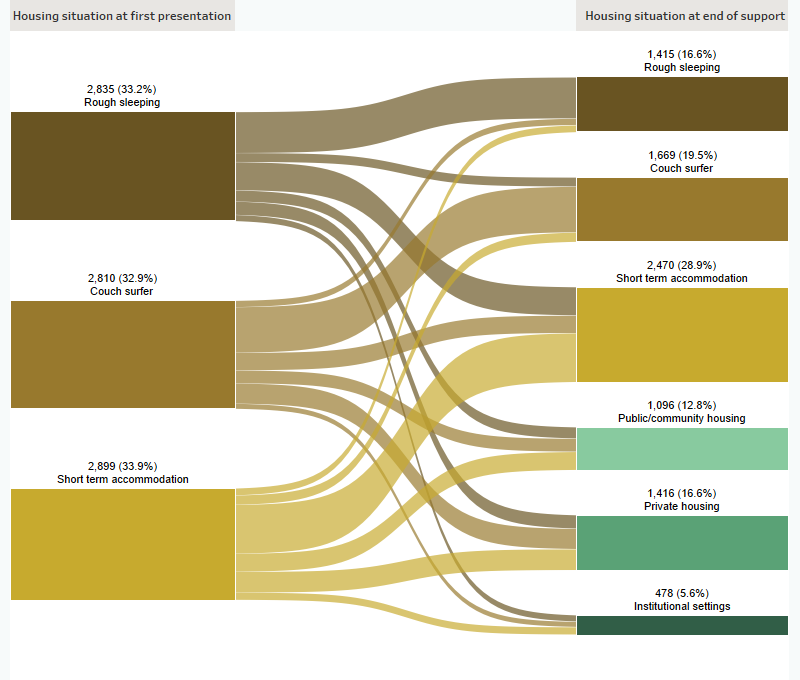
Notes:
- Excludes clients with unknown housing situation.
- Includes only those clients who ceased receiving support during the financial year (meaning that their support period(s) had closed and they were not in ongoing support at the end of the year).
Source: Specialist Homelessness Services Collection, 2019–20
References
AIHW (Australian Institute of Health and Welfare) 2020. Alcohol, tobacco & other drugs in Australia. AIHW Cat. no: PHE 221. Canberra: AIHW. Viewed 6 August 2020.
Kaleveld L, Seivwright A, Box E, Callis Z & Flatau P 2018. Homelessness in Western Australia: A review of the research and statistical evidence. Perth: Government of Western Australia, Department of Communities. Viewed 27/06/2019
Johnson C & Chamberlain G 2008. Homelessness and substance abuse: which comes first? Australian Social Work, 61(4) Viewed 1 February 2018.
Lalor, E., 2020. Inquiry into Homelessness in Victoria.
Robinson C 2014. Trauma: A cause and consequence of homelessness. In: Chamberlain C, Johnson G, Robinson C (eds.) Homelessness in Australia. Sydney, NSW: NewSouth Publishing.
Scutella R, Chigavazira A, Killackey E, Herault N, Johnson G, Moshcion J & Wooden M 2014. Journeys Home Research Report No. 4 Findings from Waves 1 to 4: Special Topics. University of Melbourne.