Dwelling and household size
Overcrowding and underutilisation in social housing
A large part of providing affordable housing that suits individuals and families is ensuring that a dwelling is of an adequate size to meet the needs of the household. Matching dwelling size to household size is not a straight forward process. It is heavily influenced by the availability of dwellings, their age, condition and location. This is in addition to the availability of options and the cost to relocate existing tenants as well as their willingness to relocate. The accepted standard by which the dwelling size requirements of a given household are measured in Australia is the Canadian National Occupancy Standard commonly referred to as CNOS (see below).
The focus of Australia’s social housing system has changed profoundly over time with a shift in the demographics of people receiving assistance—shifting from working families to recipients of income support payments [1]. About 44% of current public rental housing stock, 83% of state-owned and managed Indigenous housing (SOMIH) and 36% of mainstream community housing stock, are dwellings with 3 or more bedrooms. In contrast, the living arrangements of social housing tenants has changed over time, with single adults making up 54% of public housing households in 2016 compared to 49% in 2005 and 27% of SOMIH households in 2016 compared to just over a fifth (21%) in 2005 (comparable figures for community housing households are unavailable).
As at 30 June 2016, the majority of social housing households (around 80%) were considered to be residing in dwellings adequate to their household composition.
Canadian National Occupancy Standard (CNOS)
A measure of the appropriateness of housing that is sensitive to both household size and composition, the CNOS specifies that:
- no more than 2 people shall share a bedroom
- parents or couples may share a bedroom
- children under 5, either of the same sex or opposite sex, may share a bedroom
- children under 18 of the same sex may share a bedroom
- a child aged 5-17 should not share a bedroom with a child under 5 of the opposite sex
- single adults 18 and over and any unpaired children require a separate bedroom.
Whilst the CNOS is a useful guide to the proportion of dwellings that may be under-utilised, or a proportion of households potentially living in over-crowded conditions, there are some cases where a dwelling may not match a household size for good reason. For example, where custody of children is shared; where tenants may have live-in care arrangements; or to take into consideration future needs of children who may need separate bedrooms in years to come.
Overcrowding
In basic terms, overcrowding occurs when the dwelling is too small for the size and composition of the household living in it. A dwelling requiring at least 1 additional bedroom is designated as ‘overcrowded’ in Australia underpinned by the CNOS standard above.
As at 30 June 2016, 4% of public rental housing and 5% of community housing households were in overcrowded dwellings (see Table DHS.1). Indigenous households were more likely to experience overcrowding, with 9% of SOMIH dwellings classified as overcrowded. This is around twice the proportion experienced in both public and community housing dwellings.
| Social housing program | Overcrowded | Adequate | Underutilised(a) | Total |
|---|---|---|---|---|
| Public housing(b) | 4.2 | 79.4 | 16.4 | 100.0 |
| SOMIH | 8.9 | 66.3 | 24.8 | 100.0 |
| Mainstream community housing(c) | 5.3 | 82.5 | 12.2 | 100.0 |
| All programs | 4.5 | 79.6 | 15.9 | 100.0 |
SOMIH = state-owned and managed Indigenous housing
- The match of dwelling size to registered tenant numbers at a point in time is affected by a range of factors including changes in family structure over time, the match of housing portfolio to demand, and tenant support needs. Housing authority allocation policies do not align with the Canadian National Occupancy Standard and may provide for additional bedrooms including under circumstances such as shared parenting, carer requirements, or expectant mothers.
- For the NT, data are not currently available for around 5,000 remote public housing dwellings (including households and tenants).
- Qld provided partial unit record tenant data for the first time in 2015–16 (unit record data was not available for 3,840 households). Unit record data are not provided for the NT.
Notes
- Data are based on the Canadian National Occupancy Standard and only includes those households where required details are known.
- Data for utilisation in Indigenous community housing were unavailable.
Source: AIHW National Housing Assistance Data Repository, 2015–16.
Location
The proportion of households in overcrowded dwellings varied across social housing programs, jurisdictions and remoteness areas.
As at 30 June 2016, the Northern Territory had the highest proportion of public housing households living in overcrowded dwellings (8%), followed by Victoria (5%). South Australia had the lowest proportion of public housing households living in overcrowded conditions (2%). SOMIH households in Queensland experienced the highest proportion of overcrowding (12%), whereas SOMIH households in Tasmania reported the lowest (4%). Community housing had the highest proportion of households experiencing overcrowding in New South Wales (9%), and the lowest proportion in the Australian Capital Territory (1%) (Refer to supplementary tables for details ).
Overall, Indigenous households were more likely than non-Indigenous households to be living in overcrowded conditions. The higher level of overcrowding among Indigenous households may be associated with a number of factors, including cultural and social factors, higher levels of unmet demand for affordable housing, and geographical location limiting their housing options.
The proportion of Indigenous households in social housing living in overcrowded conditions generally increased with remoteness. Indigenous households experiencing overcrowding in public rental housing, were more likely to be in Very remote (13%) and Remote (11%) areas than Major cities (9%). SOMIH households in Very remote (16%) and Outer regional (10%) areas were also more likely to be living in overcrowded conditions than SOMIH households living in Major cities (8%).
Overcrowding within Indigenous households increased with remoteness
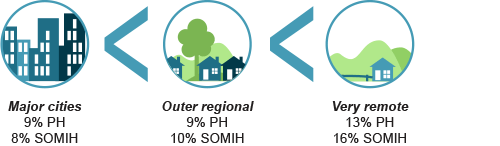
PH=public rental housing; SOMIH=state-owned and managed Indigenous housing
Trends
Between 2010–11 and 2015–16, the prevalence of overcrowding has varied across social housing programs. However, the proportion of SOMIH households living in overcrowded conditions has consistently remained more than double that of other social housing programs. Apart from a slight increase to 5% in 2012–13, overcrowding in public housing has remained stable at around 4% between 2010–11 and 2015–16. On the other hand, overcrowding in SOMIH decreased slightly from 10% in 2010–11 to just under 9% in 2015–16. Overcrowding in community housing has increased from 2% to 5% over the same period.
Figure DHS.1: Proportion of overcrowded households in social housing, 2010–11 to 2015–16
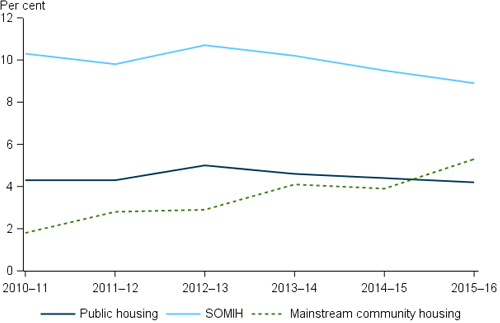
SOMIH = state-owned and managed Indigenous housing
Note: In 2015–16, changes to data collection, cleaning and submission implemented by Australian jurisdictions contributed to changes in captured cases of overcrowding, particularly in mainstream community housing.
Source: AIHW National Housing Assistance Data Repository 2015–16, Matching dwelling size to household size Table OVER.4.
Underutilisation
Just as a dwelling can be overcrowded, it can also be underutilised. A dwelling is said to be underutilised when it consists of 2 or more bedrooms surplus to the household requirements, as determined by CNOS measures. Underutilisation can arise as a household ages and children leave the family home. Tenants may have been living in a home for many years and their economic, social and community life is centred around that location, and there are no suitable alternatives for relocation. Underutilisation also occurs, in part, due to the public housing stock itself being dominated by family-sized homes with 3 or more bedrooms in addition to problems faced by social housing providers needing to adjust rental dwelling size to accommodate changing household sizes.
As at 30 June 2016, 16% of public housing and 12% of community housing households were in underutilised dwellings (see Table DHS.1). Social housing targeted towards Indigenous households had the highest proportion of underutilisation with 25% of SOMIH households living in underutilised dwellings.
Location
The proportion of households in underutilised dwellings varied by jurisdiction and remoteness areas across the social housing programs.
For public housing, South Australia had the highest proportion of households in underutilised dwellings at over 1 in 4 households (26%), followed by the Australian Capital Territory (17%). The Northern Territory had the lowest proportion of underutilisation (7%) (Refer to supplementary tables for details ).
For SOMIH households, South Australia reported the highest proportion of underutilisation (30%), followed by New South Wales (28%). Tasmania reported the lowest proportion of underutilisation (17%) across all states and territories.
For households in community housing dwellings, South Australia had the highest proportion of underutilisation (22%), followed by Tasmania (15%). Queensland and the Australian Capital Territory experienced the lowest proportion of underutilisation at around 4%. A ten percentage point drop in Tasmania’s proportion of community housing underutilisation from 25% in 2014–15 to 15% in 2015–16 can be attributed, in part, to a reduction in the number of three bedroom dwellings and an increase in the number of flats, units and apartments.
The proportion of households in underutilised dwellings in public housing varied substantially across remoteness areas with Outer regional areas most likely to be underutilised (22%) compared to 15% in Major cities and Remote areas. Underutilisation of SOMIH dwellings ranged from 21% in Very remote areas to 26% in both Major cities and Inner regional areas.
Trends
Between 2010–11 and 2015–16, trends in underutilisation across community housing households have been varied, whereas SOMIH and public housing underutilisation has remained relatively static over time (Figure DHS.2).
Public housing underutilisation has remained steady between 2010–11 and 2015–16 at 16%. SOMIH underutilisation has also remained fairly steady with a slight increase to 25% in 2015–16 from 23% in 2010–11. In contrast, underutilisation in community housing has doubled; from 6% in 2010-11 to 12% in 2015–16, however, community housing has maintained comparatively low levels of underutilisation when compared to other social housing programs.
Figure DHS.2: Proportion of underutilised households in social housing, 2010–11 to 2015–16

SOMIH = state-owned and managed Indigenous housing
Source: AIHW National Housing Assistance Data Repository 2015–16, Matching dwelling size to household size Table UNDER.7.
References
- PC (Productivity Commission) 2016. Introducing Competition and Informed User Choice into Human Services: Identifying Sectors for Reform. Study Report. Canberra: PC.