Priority groups and waiting lists
Figure PRIORITY.1: Newly allocated households, by greatest need status and social housing program, 2009–10 to 2018–19. This vertical stacked bar graph shows, for public housing, community housing and SOMIH, the number of greatest needs households was higher than the number of other households, from 2009–10 to 2019–20. In 2019–20, the majority of new public housing allocations were provided to households in greatest need (76%). Between 2009–10 and 2019–20, this proportion fluctuated between 73–82%. In 2009–10, 57% of newly allocated SOMIH dwellings were provided to households in greatest need; this increased to 65% in 2019–20. Prior to 2017–18, the proportion of community housing allocations to households in greatest need was increasing, from 63% in 2009–10 to 86% in 2016–17; the proportion then decreased to 66% in 2018–19. However, in 2019-20 housing allocations to greatest need rose to 82%.
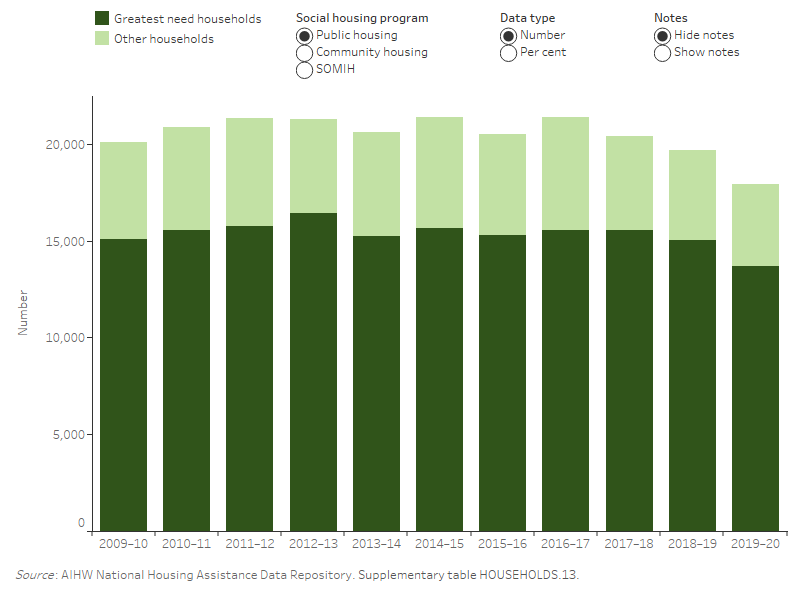
Figure PRIORITY.2: Newly allocated households in greatest need, by main reason for greatest need and social housing program, 2011–12 to 2019–20. This vertical line graph shows the main reason for greatest need of newly allocated households. In 2011–12, the main reason for greatest need in public housing was homelessness (55%); this decreased to 51% in 2019–20. For those at risk of homelessness in public housing, in 2011–12, the main reason for greatest need was health condition aggravated by housing (15%); in 2019–20, the main reason was life or safety at risk in accommodation (21%).
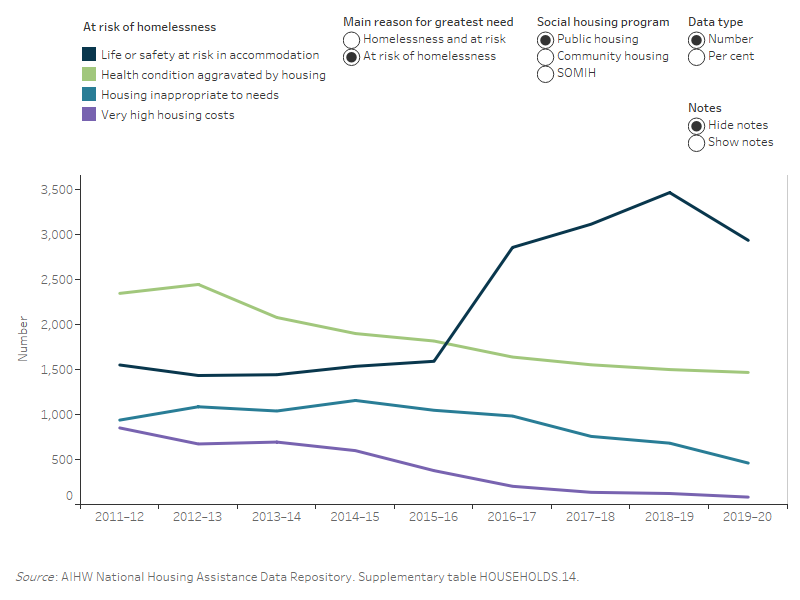
Figure PRIORITY.3: Newly allocated households (per cent), by greatest need and/or special needs status, for public housing and SOMIH, 2019–20. The Venn diagram shows the overlap of greatest needs and special needs newly allocated households in public housing and SOMIH. In 2019–20, of the newly allocated households in public housing, 24% had greatest needs only, 12% had special needs only and 45% were both greatest needs and special needs households. Of the newly allocated households in SOMIH, 34% had greatest needs only, 14% had special needs only and 30% were both greatest needs and special needs households.
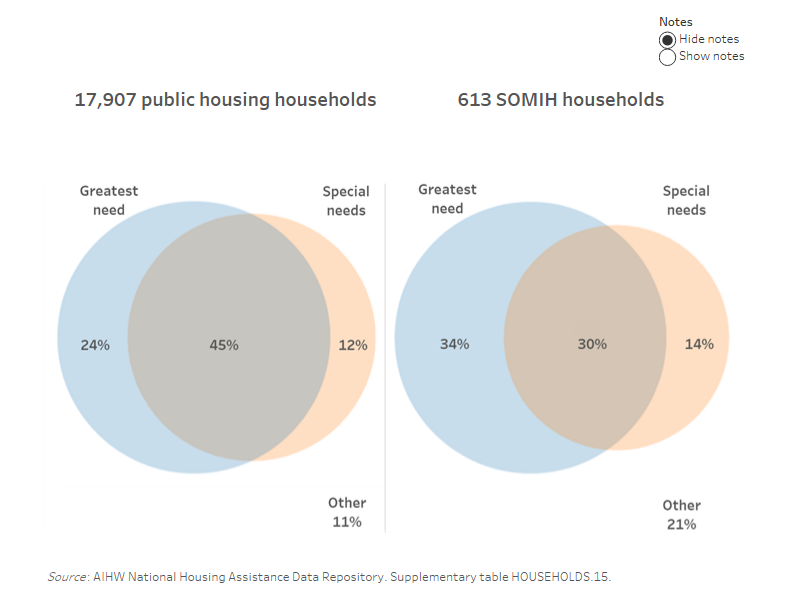
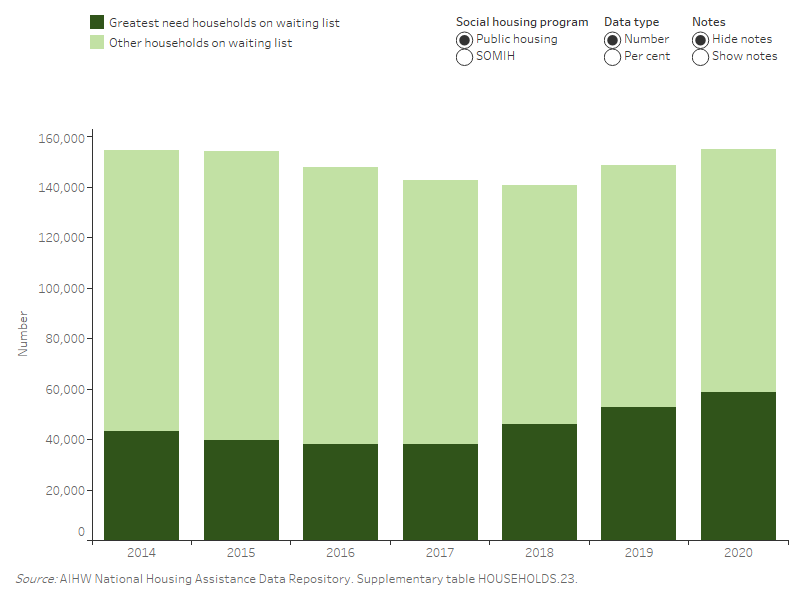
Figure WAITLIST.1: Households on waiting list, by greatest need status, for public housing and SOMIH, 2014 to 2020.This vertical stacked bar graph shows that the number of greatest need households on waiting list has increased for public housing, with 58,500 (38%) in 2020, compared with 43,200 (28%) in 2014. Similarly, the number of other households on waiting list has increased, with 6,500 in 2020, compared with 4,200 in 2014. For SOMIH, the number of greatest need households on the waiting list has increased, with 4,400 (41%) in 2020, compared with 3,800 (48%) in 2014. However, the number of greatest need households on the waiting list has decreased relative to 2019, with 5,700 (47%) compared with 4,400 (41%) in 2020.