Which types of falls resulted in hospitalisation and death?
Hospitalisations
In 2019–20, among Australians aged 65 and over hospitalised for a fall:
- 3 in 5 (60%, 80,100) fell on a single-level surface (including a fall on the same level from slipping, tripping, and stumbling and other types of falls on the same level)
- 7.3% (9,700) had a fall involving furniture (including beds, chairs and other types of furniture)
- 7.2% (9,600) fell from one level to another (fall on and from stairs or steps and other fall from one level to another)
- 22% (28,600) of hospitalised falls were of unspecified type (Table 7).
|
Type of fall |
Number |
% |
Crude rate (per 100,000) |
|---|---|---|---|
|
Fall on same level from slipping, tripping, and stumbling (W01) |
46,162 |
35 |
1,121 |
|
Other fall on same level (W18) |
33,630 |
25 |
817 |
|
All falls on same level (W00, W01, W03 and W18) |
80,094 |
60 |
1,945 |
|
Fall involving bed (W06) |
5,905 |
4.4 |
143 |
|
Fall involving chair (W07) |
3,632 |
2.7 |
88 |
|
Fall involving other furniture (W08) |
138 |
0.1 |
3.4 |
|
Fall involving furniture (including bed, chair and other) (W06–08) |
9,675 |
7.3 |
235 |
|
Fall involving wheelchair (W05) |
949 |
0.7 |
23 |
|
Fall on and from stairs and steps (W10) |
7,832 |
5.9 |
190 |
|
Other fall from one level to another (W17) |
1,738 |
1.3 |
42 |
|
All falls from one level to another (W10 and W17) |
9,570 |
7.2 |
232 |
|
Fall on and from ladder (W11) |
2,420 |
1.8 |
59 |
|
Fall involving ice-skates, skis, roller-skates, skateboards, scooters, and other pedestrian conveyances (W02) |
657 |
0.5 |
16 |
|
Fall from, out of or through building or structure (W13) |
659 |
0.5 |
16 |
|
Other specified types of falls (W04, W09, W12, W14–16) |
303 |
0.2 |
7.4 |
|
Unspecified fall (W19) |
28,606 |
22 |
695 |
|
Total |
132,933 |
100 |
3,228 |
Notes
1. Percentages may not tally to 100 due to rounding.
2. Codes in brackets refer to the ICD–10 (11th edition) external cause codes (ACCD 2017).
Source: AIHW National Hospital Morbidity Database.
Types of falls with notable differences in rates between younger and older people were:
- falls on the same level – those aged 65 and over were 11 times as likely to be hospitalised for this type of fall compared to those aged 15–64
- fall involving ice-skates, skis, roller-skates, skateboards, scooters, and other pedestrian conveyances – those aged 15–64 were 1.4 times as likely to be hospitalised for this type of fall compared to those aged 65 and over. This was one of the few types of falls with higher rates in a younger age group.
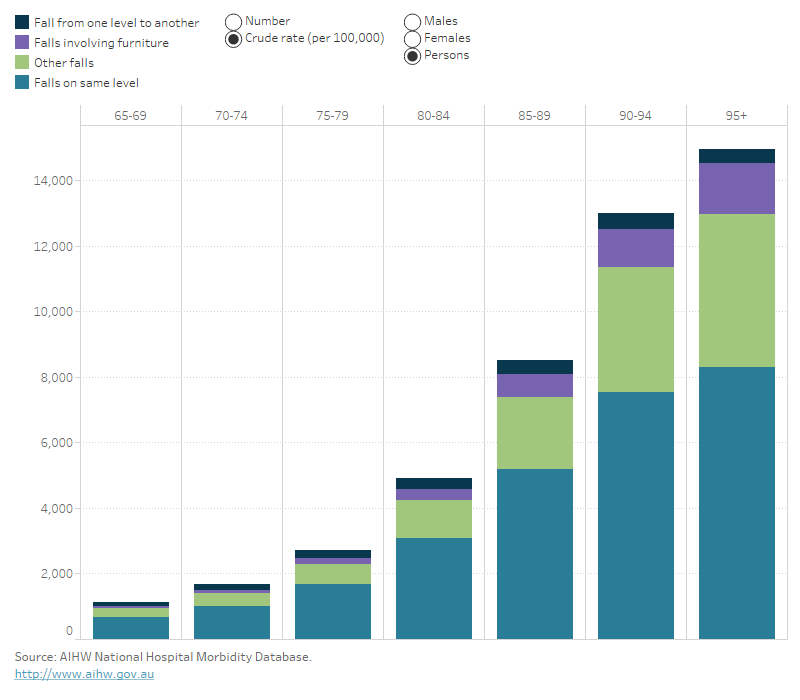
The type of fall with the most notable difference between male and female age-standardised hospitalisation rates was falls involving ladders (95.8 cases per 100,000 males; 26.4 cases per 100,000 females) (Figure 7).
Figure 7: Selected types of falls resulting in hospitalisation, by age group and sex, 65 years and over, 2019–20
Stacked column graph showing that falls on the same level were the most common type of fall leading to hospitalisation, whereas other falls were the most common fall type leading to death in all ages.

For more detailed data, see Data tables A13–15 and C9–10.
Deaths
There is poor coverage of the fall type in the National Mortality Database: 89% of deaths due to falls are classified as ‘unspecified’ or ‘other’. Therefore, data presented here on specific types of falls that resulted in death are likely to be undercounts.
Among the 561 falls resulting in death where type-of-fall data was recorded in the data source, 6.5% occurred on a single-level surface (for example, by slipping or due to a collision) (Table 8). Among falls resulting in death, 1.4% involved stairs or steps (Table 8).
|
Type of fall |
Number |
% |
Crude rate |
|---|---|---|---|
|
Slipping, tripping, or stumbling on same level (W01) |
288 |
5.7 |
7.0 |
|
Other falls on same level (W03 and W18) |
38 |
0.8 |
0.9 |
|
Falls on same level (W01, W03, W18) |
326 |
6.5 |
7.9 |
|
Fall on or from stairs or steps (W10) |
54 |
1.1 |
1.3 |
|
Other fall from one level to another (W17) |
16 |
0.3 |
0.4 |
|
Falls from one level to another (W10, W17) |
70 |
1.4 |
1.7 |
|
Fall while being carried or supported by other persons (W04) |
4 |
0.1 |
0.1 |
|
Fall involving bed, chair, or other furniture (W06-W08) |
108 |
2.1 |
2.6 |
|
Fall involving wheelchair (W05) |
11 |
0.2 |
0.3 |
|
Fall on and from ladder, building, tree, cliff or into water (W13-W16) |
42 |
0.8 |
1.0 |
|
Unspecified fall (W19) |
2,897 |
57.5 |
70 |
|
Other fall excluded from above (X59) |
1,576 |
31.3 |
38 |
|
Total |
5,034 |
100 |
122 |
Notes
1. Percentages may not total 100 due to rounding.
2. Codes in brackets refer to the ICD–10 (2019 version) codes (WHO 2019).
Source: AIHW National Mortality Database.
For more detailed data, see Data tables B13–14.


