Acute care
This section presents data for the acute care indicators supplied by Australia to the OECD HCQO collection. It compares these data with the results reported for other OECD countries, and comments on the comparability of the data provided to the OECD specification (HCQO indicators 2022–23 definitions [PDF 1.75MB]).
The OECD published all acute care indicators in OECD.Stat and a selection of these indicators in Health at a glance 2023. Australia calculated and submitted 3 of the 7 acute care indicators requested. The OECD specifications request patient-based and admission-based data. Australia has supplied data for the admission-based indicators but uses hospital separations data (that is, where the data are captured at the point at which an episode of care for an admitted patient ends). These indicators are:
- Acute myocardial infarction (AMI) in-hospital mortality rate
- Haemorrhagic stroke in-hospital mortality rate
- Ischaemic stroke in-hospital mortality rate.
The acute care indicators measure the proportion of total separations where the patient died in the hospital within 30 days of admission, within the one episode of care. In-hospital mortality rates for AMI and stroke may reflect the quality of care provided for those conditions (OECD 2023).
The indicator definitions can be viewed here: Acute care indicator definitions.
Overall data comparability and methods
The most recent data supplied by Australia for the acute care indicators is for 2020–21, recorded as 2020 in the OECD.Stat database. In this report, we present the latest data when comparing Australia with other OECD countries and provide 10-year Australian data to illustrate time trends. Data from other OECD countries published on OECD.Stat for 2020 are used for comparison and calculation of OECD averages in this section. These data were extracted from the OECD.Stat database in January 2024, and may not reflect subsequent updates made to the database.
The OECD requested acute care data for adults aged 45 and over only, disaggregated by age and sex. The OECD then calculated age-sex standardised rates (standardised to the equivalent 2015 OECD population) for these indicators based on the supplied data. The indicators are presented on the same basis here.
Australia’s national data collection for admitted patients can identify if a patient dies during a single episode of care in one hospital. However, if a patient is discharged from hospital and subsequently re-admitted to the same or a different hospital (for example, as a result of a complication), or had a change in the type of care provided (for example, from acute care to rehabilitation care), and then subsequently died within 30 days of the original hospital admission, that death would not be reported by the AIHW as part of these indicators. This is because data for the original admissions are not ‘linked’ to the subsequent admissions in the national data collection. As a result, the acute care indicators reported by the AIHW may underestimate true in-hospital fatality rates.
Acute myocardial infarction (AMI) in-hospital mortality rate
The AMI in-hospital mortality indicator measures deaths as a result of AMI that occurred within 30 days of hospital admission. AMI is a life-threatening event that occurs when a blood vessel supplying the heart is suddenly blocked, causing damage to the heart muscle and its functions.
Comparisons are presented for other OECD countries that reported data for this indicator (that is, based on admissions data, not patient data). Note that the AIHW could only provide data for separations where death occurred within the one (hospital) episode of care.
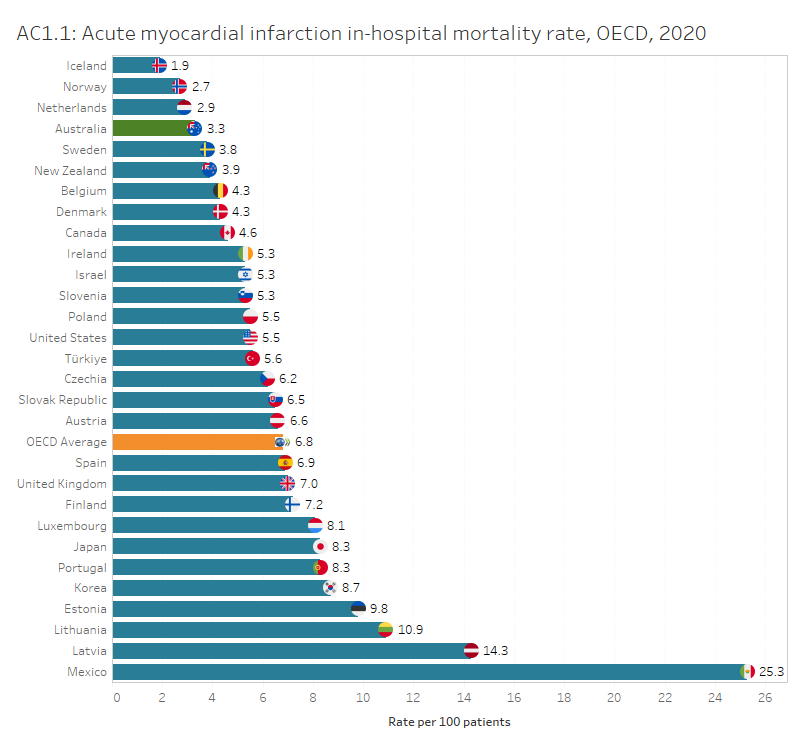
In Australia, the AMI in-hospital mortality rate in 2020 was 3.3 per 100 separations, lower than the OECD average of 6.8 deaths per 100 separations. Among the countries that provided data for this indicator for 2020, Iceland, Norway, and the Netherlands reported the lowest mortality rates (1.9, 2.7 and 2.9 per 100 separations, respectively).
Australia’s overall rate has decreased from 4.7 per 100 separations in 2011, consistent with the overall decline in coronary heart disease mortality over the past decades among other OECD countries. The trend may be attributed to reductions in smoking and improvements in treatment for heart diseases (OECD 2023).
Interactive AC1.1 below compares OECD countries with data published for this indicator for 2020, while AC1.2 presents Australia’s 10-year trend for this indicator where data are available.
Figures AC1.1 and AC1.2
AC1.1 presents OECD countries with data published for AMI in-hospital mortality rate in 2020, which shows Australia had one of the lowest mortality rates. AC1.2 presents Australia’s 10-year trend for this indicator, which shows an overall decrease.
Refer to the data tables for more information.
Haemorrhagic stroke in-hospital mortality rate
The haemorrhagic stroke in-hospital mortality indicator measures deaths as a result of haemorrhagic stroke that occurred within 30 days of hospital admission. Haemorrhagic stroke occurs when a blood vessel supplying blood to the brain ruptures and begins to bleed.
Comparisons are presented for other OECD countries that reported data for this indicator (that is, based on admissions data, not patient data). Note that the AIHW could only provide data for separations where death occurred within the one (hospital) episode of care.
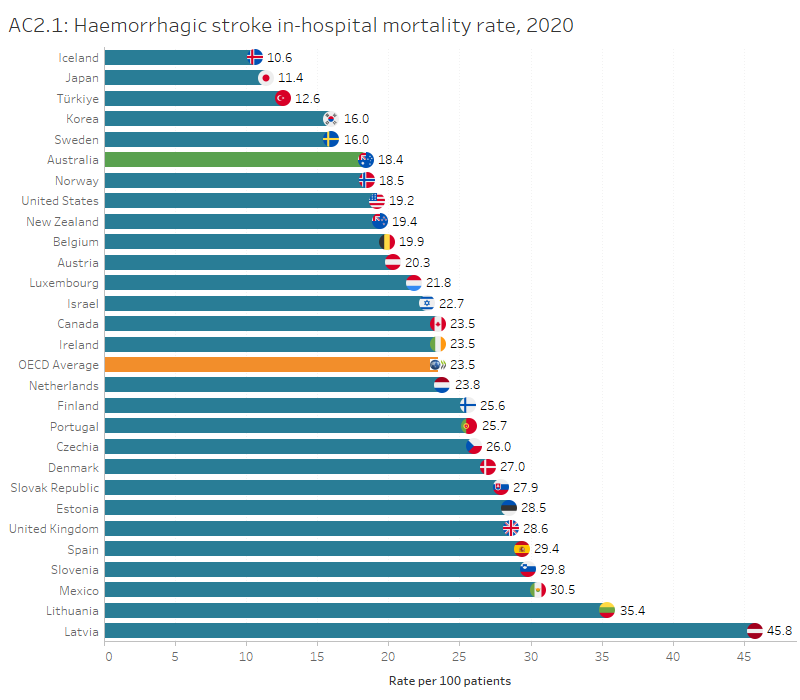
In Australia, the haemorrhagic stroke in-hospital mortality rate was 18 per 100 separations, lower than the OECD average of 23.5 deaths per 100 separations. Among the countries that provided data for this indicator for 2020, Iceland and Japan had the lowest mortality rates (10.6 and 11.4 per 100 separations, respectively).
In Australia, the haemorrhagic stroke in-hospital mortality rate was higher for females than males (20 and 17 per 100 separations, respectively). Australia’s overall rate has decreased over time from 23 per 100 separations in 2011.
Interactive AC2.1 below compares OECD countries with data published for this indicator for 2020, while AC2.2 presents Australia’s 10-year trend for this indicator where data are available.
Figures AC2.1 and AC2.2
AC2.1 presents OECD countries with data published for haemorrhagic stroke in-hospital mortality rate in 2020, which shows Australia had a lower mortality rate than the OECD average. AC2.2 presents Australia’s 10-year trend for this indicator, which shows an overall decrease over time.
Refer to the Data tables for more information.
Ischaemic stroke in-hospital mortality rate
The ischaemic stroke in-hospital mortality indicator measures deaths as a result of ischaemic stroke that occurred within 30 days of hospital admission. Ischaemic stroke occurs when a blood vessel supplying blood to the brain suddenly becomes blocked.
Comparisons are presented for other OECD countries that reported data for this indicator (that is, based on admissions data, not patient data). Note that the AIHW could only provide data for separations where death occurred within the one (hospital) episode of care.
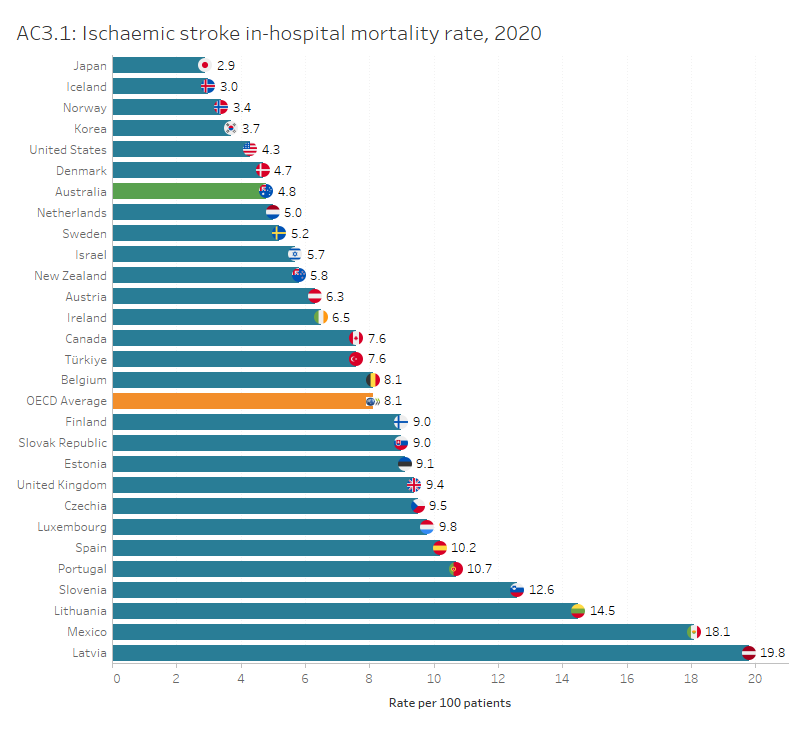
In Australia, the ischaemic stroke in-hospital mortality rate was 4.8 per 100 separations, lower than the OECD average of 8.1 deaths per 100 separations. Among the countries that provided data for this indicator for 2020, Japan and Iceland had the lowest mortality rates (2.9 and 3.0 per 100 separations, respectively).
In Australia, the ischaemic stroke in-hospital mortality rate was slightly higher for females than males (4.9 and 4.4 per 100 separations, respectively). Australia’s rate has decreased from 8.3 per 100 separations in 2011.
Interactive AC3.1 below compares OECD countries with data available for this indicator for 2020, while AC3.2 presents Australia’s 10-year trend for this indicator where data are available.
Figures AC3.1 and AC3.2
AC3.1 presents OECD countries with data published for ischaemic stroke in-hospital mortality rate in 2020, which shows Australia’s mortality rate was below the OECD average. AC3.2 presents Australia’s 10-year trend for this indicator, which shows a decreasing trend.
References
OECD 2023. Health at a glance 2023: OECD indicators. Paris: OECD.