This section examines how health service use and costs in the last year of life differ by the main (underlying) cause of death. These are shown by both:
- broad causes based on chapter level groups in the International Classification of Diseases and Related Health Problems: 10th Revision (ICD-10) (for example, diseases of the circulatory system)
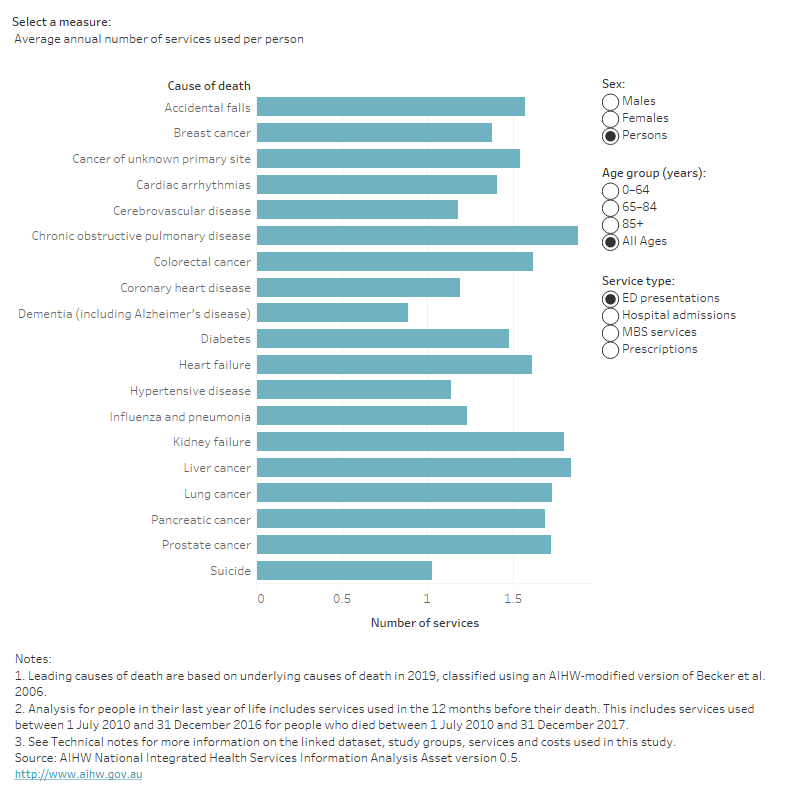
- specific or underlying causes of death (for example, coronary heart disease). Only the 20 leading causes in Australia were examined.
Visualisations in this section explore health service use and costs in the last year of life by cause of death (broad or underlying), sex, age and service type (hospital admissions, ED presentations, MBS services, and prescriptions supplied under the PBS/RPBS).
Health expenditure over the study period for the 4 health services examined was highest among people who died from cancer ($10.2 billion), followed by cardiovascular diseases ($4.7 billion). These two groups also had the highest number of deaths over the period (335,000 and 331,000 deaths respectively).
Younger people were less likely to use a health service in their last year of life
Overall, 2.7% of people who died did not use any of the 4 health services in their last year of life. The highest proportion of people who did not use any of the 4 services in their last year of life was among people who died by suicide (10%).
By broad cause of death, 8.1% of people who died from external causes (injury and poisoning) did not use a service in their last year of life. For all other broad causes, less than 3% did not use a service in their last year of life.
The proportion of people who did not use any health service in their last year of life varied by age and underlying cause of death:
- 8.6% of people who died aged 0–64 did not use a service in their last year of life compared with 1.4% of people who died aged 65 and over
- 11% of people who died aged 0–64 from either coronary heart disease, accidental falls or by suicide did not use a service in their last year
- among people who died aged 65–84, 3.5% who died by suicide and 3.2% who died from coronary heart disease did not use a service in their last year
- among people who died aged 85 and over, the proportion who did not use a service in their last year of life was less than or around 2% for each leading cause of death.
Among males aged 0–64, 13% who died by suicide, 12% who died from coronary heart disease, and 12% who died from accidental falls did not use a service in their last year of life. For females of the same age, 7.4% who died from influenza and pneumonia did not use a service in their final year.
By disease group, average health service costs were highest for people who died from infectious diseases
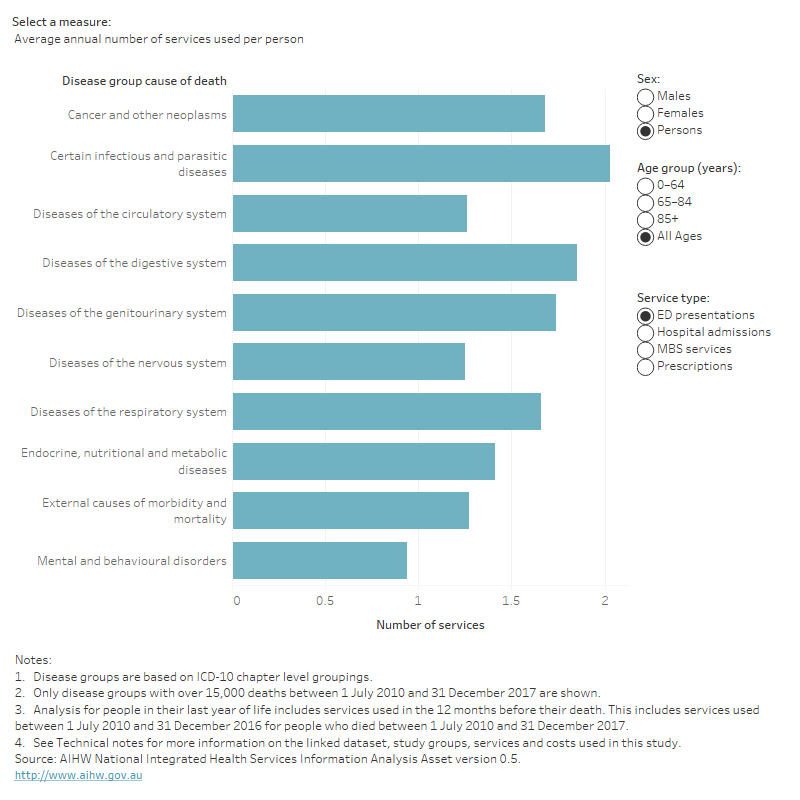
Figure 3 shows for each person, the average annual number of health services (Figure 3a) and average annual cost of these services (Figure 3b) by age, sex, and service type for each broad cause of death grouping.
Overall, the average annual cost per person in the last year of life for the 4 health services combined was highest among people who died from infectious diseases ($35,200 per person) followed by neoplasms (cancer; $35,000).
By service type, the highest average annual costs in the last year of life were:
- $27,700 per person for hospital admissions and $1,100 per person for ED presentations for people who died from infectious diseases. Per person, this group had the third highest average annual number of hospital admissions (3.7, behind people who died from genitourinary diseases (7.4) and from endocrine, nutritional and metabolic diseases (4.3)) and the highest number of ED presentations (2.0).
- $7,600 per person for MBS services and $7,500 per person for prescriptions supplied under the PBS/RPBS for people who died from cancer. Per person, this group had the highest average annual number of MBS services (97.5) and the fourth highest number of prescriptions supplied under the PBS (64, with the highest being for people who died from respiratory diseases (76)).
Overall and for each service type, average annual costs were lowest for people who died from mental and behavioural disorders ($9,100 per person) and external causes, meaning injury and poisoning ($12,800). These 2 groups often had the lowest number of services used per person for each service type.
Among people who died from infectious diseases, average annual costs for the 4 health services combined decreased with age from $55,300 per person for those aged 0–64 to $19,100 for those aged 85 and over. By sex, the average annual cost of health services in the last year of life was highest for females who died from cancer ($33,200 per female) and males who died from infectious diseases ($40,000 per male).
This study relates to the period before the outbreak of COVID-19 in Australia. The leading causes of death from infectious diseases over the study period were streptococcal and other sepsis (ABS 2021).