Health service use and expenditure for people who used residential aged care services

Previous Australian-based research suggests that the use of health services can change after people enter permanent residential aged care. For example, on average after entry, the median number of prescriptions dispensed and average number of GP services increased, but the average number of specialist services decreased (AIHW 2020; Inacio et al. 2021).

While this study did not explore health service use and costs before and after entry into residential aged care, patterns of health service use and associated costs were compared between people who used and did not use residential aged care services (permanent residential and/or respite care) in their final year. For those who used such services, not all would have spent the entire 12 months in aged care or would necessarily have died in a residential aged care facility. Some people living in aged care could have died elsewhere, such as in hospital (AIHW 2021c).

The analysis in this section was restricted to people aged 85 and over, as most deaths in aged care occur in this age group.

Visualisations in this section explore health service use and costs by sex, service type (hospital admissions, ED presentations, MBS services, and prescriptions supplied under the PBS/RPBS) and whether people were in their last year of life.

More prescriptions supplied to people who used residential aged care in their last year of life

On average, people who used residential aged care in the last year of life had (Figure 5):

  • 27% more prescriptions supplied under the PBS/RPBS than those who did not use residential aged care in their final year (72 and 57 prescriptions per person respectively). A similar result was found for people not in their last year of life. These findings are consistent with those previously reported for the average number of prescriptions dispensed before and after entry into permanent residential aged care (AIHW 2019; AIHW 2020).
  • Fewer hospital admissions and MBS services (1.3 and 45 per person respectively) than people who did not use residential aged care in their final year (2.0 and 53 per person). The lower use of MBS services among people who used residential aged care may be partly due to some of these people accessing GPs by other channels, such as through DVA health-care services, which are not included in MBS claims.
  • Similar number of ED presentations than people who did not use residential aged care in their final year (1.2 and 1.3 per person respectively). In contrast, among people not in the last year of life, those who used residential aged care had a higher average annual number of ED presentations per person than people who did not use residential aged care.

Figure 5: Average annual number of health services used per person by sex, service type, use of residential aged care and whether in last year of life

Figure 5 is a bar chart showing the average annual number of health services used per person for people aged 85 and over by sex, service type (ED presentations, hospital admissions, MBS services and prescriptions supplied under the PBS/RPBS), whether they used residential aged care (respite and/or permanent residential aged care) and whether they were in their last year of life or not. On average, people who used residential aged care in the last year of life had 27% more prescriptions supplied under the PBS/RPBS than those who did not use residential aged care in their final year (72 and 57 prescriptions per person respectively). A similar result was found for people not in their last year of life. For MBS services and hospital admissions, the average number of services used per person was lower for people who used residential aged care in their last year of life compared with people who did not use residential aged care in their last year of life. The average number of ED presentations per person was similar among people who used and did not use residential aged care in their last year of life.

Average costs were lower for people who used residential aged care in their last year of life

Of the $23.6 billion spent on the 4 health services for people in their last year of life, $6.1 billion (26%) was on those who used residential aged care. For people who died aged 85 and over, $3.2 billion (55%) was spent on people who used residential aged care in their final year.

Average annual costs for people who used residential aged care in their last year were 27% lower than for those who did not use such care in their final year ($12,500 and $17,000 per person). These costs were higher than for people not in the last year of life, irrespective of whether they used residential aged care (Table 1).

Table 1: Average annual costs per person, by whether in last year of life and use of residential aged care

  In last year of life Not in last year of life Ratio
Used residential aged care $12,488 $6,852 1.8
Did not use residential aged care $17,023 $5,126 3.3
Ratio 0.7 1.3 . .

Note: Includes costs for services for people aged 85 and over only.

Source: AIHW National Integrated Health Services Information Analysis Asset version 0.5.

Average annual costs for people who used residential aged care in their final year were higher for men than women ($14,600 per male compared with $11,400 per female) (Figure 6).

Average annual costs per person for those who used residential aged care in their last year of life were lower for all 4 health service types (Figure 6):

  • 32% lower for hospital admissions ($7,100 per person compared with $10,400 for people who did not use residential aged care in their final year)
  • 16% lower for ED presentations ($580 per person compared with $700)
  • 23% lower for MBS services ($2,600 per person compared with $3,400)
  • 14% lower for prescriptions supplied under the PBS/RPBS ($2,200 per person compared with $2,500).

Note that costs of aged care or any health care (and associated costs) delivered as part of community aged care and residential aged care services (and not through MBS, PBS/RPBS or hospital care), as well as outpatient care, are not included in these estimates.

Figure 6: Average annual health service costs per person by sex, service type, use of residential aged care and whether in last year of life

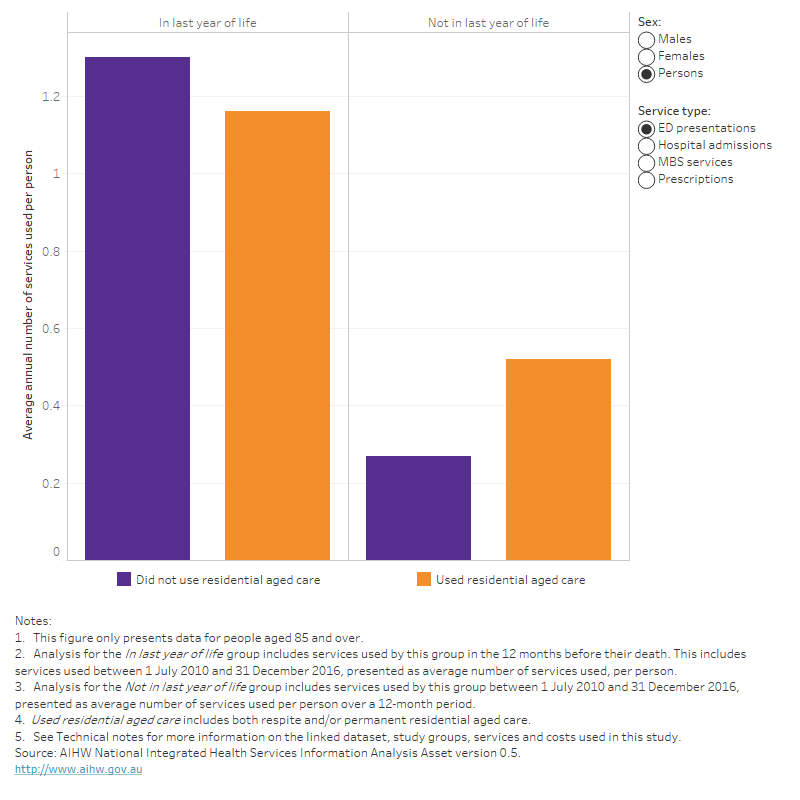
Figure 6 is a bar chart showing the average annual health service costs per person for people aged 85 and over by sex, service type (ED presentations, hospital admissions, MBS services and prescriptions supplied under the PBS/RPBS), whether they used residential aged care (respite and/or permanent residential aged care) and whether they were in their last year of life or not. Average annual costs per person for those who used residential aged care in their last year of life were lower for all 4 health service types. The largest difference was for hospital admissions, for which the average annual cost was 32% lower for people who used residential aged care in their last year of life than for people who did not use residential aged care in their final year ($7,100 per person compared with $10,400).

Dementia and coronary heart disease were the leading causes of death among people who used residential aged care

The leading causes of death among people who used residential aged care in their last year of life were dementia (including Alzheimer’s disease) (19%) and coronary heart disease (16%). For those who did not use such care in their last year, coronary heart disease (17%) and cerebrovascular disease (8%) were the leading causes.

Among all people who died from dementia (including Alzheimer’s disease), 88% used residential aged care in their last year of life.

By cause of death, average costs were mostly lower for people who used residential aged care in their final year

For most broad causes of death, average annual costs per person for people who used residential aged care in their last year of life were lower than for those who did not use such care (Figure 7b). The biggest difference was for deaths from diseases of the nervous system, with the average annual cost 30% lower for people who used residential aged care in the last year of life than for those who did not use such care ($10,000 compared with $14,200 per person). This may reflect differences in the types of nervous system diseases people died from between these groups. Most people who died from dementia in this study used residential aged care in their last year of life.

Looking at the 10 leading causes of death among people aged 85 and over, average annual costs per person who used residential aged care in their final year were also lower than for people who did not use residential aged care (Figure 7d). The largest difference was for deaths from influenza and pneumonia, with the average cost 26% lower than for people who did not use such care ($11,000 compared with $14,900 per person).

For the 10 leading causes of death, people who used residential aged care in their last year of life were supplied with more prescriptions per person than those who did not use such care in their final year (Figure 7c). The difference was greatest for deaths from dementia (including Alzheimer’s disease) (59 compared with 43 prescriptions per person) and from colorectal cancer (71 compared with 52 prescriptions per person).

Figure 7: Health services used and costs (total and average annual per person) in the last year of life by broad cause of death (a, b) and leading underlying cause of death (c, d), sex, service type and use of residential aged care

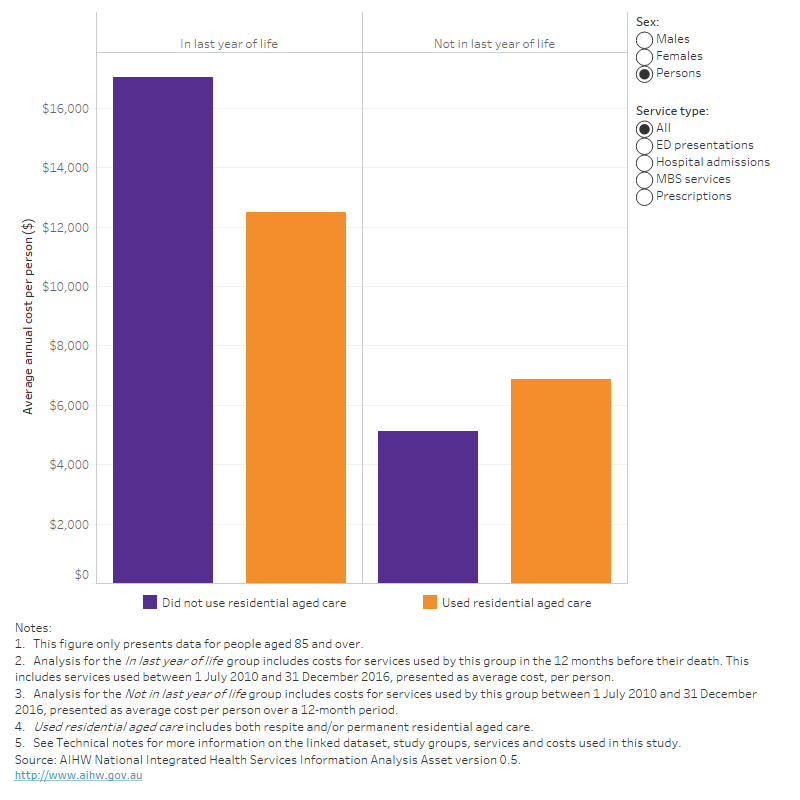
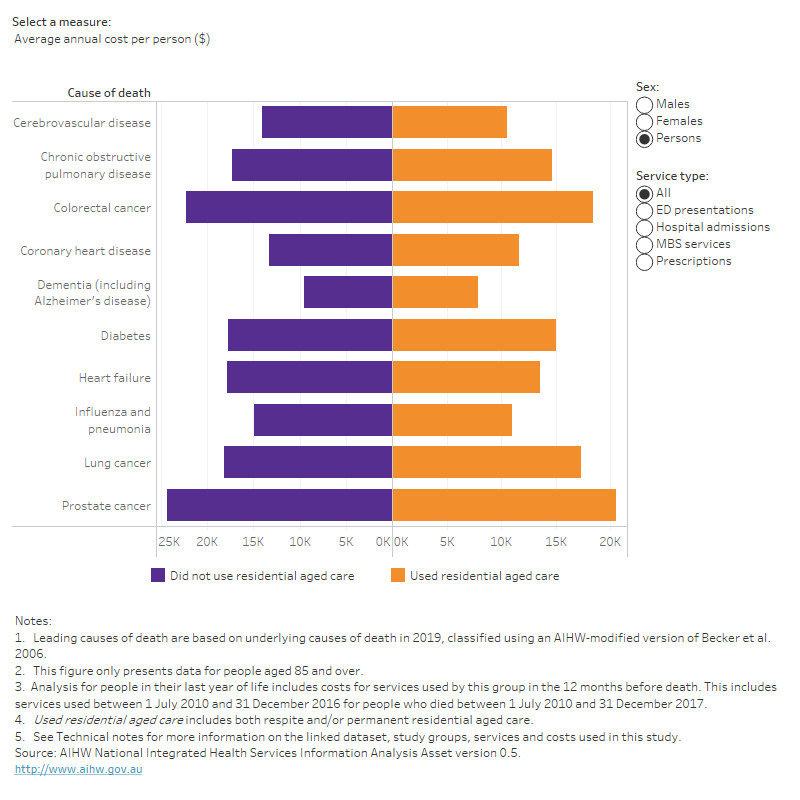
Figure 7 is a butterfly chart showing the total and average annual number of health services used, and the total and average annual cost of these services, for people aged 85 and over by sex, service type (ED presentations, hospital admissions, MBS services and prescriptions supplied under the PBS/RPBS) for each broad cause of death grouping (figures 7a and 7b) and for the 10 leading underlying causes of death (figures 7c and 7d). For the 10 leading causes of death, people who used residential aged care in their last year of life were supplied with more prescriptions per person than those who did not use such care in their final year. The difference was greatest for deaths from dementia (including Alzheimer’s disease) (59 compared with 43 prescriptions per person) and from colorectal cancer (71 compared with 52 prescriptions per person). For the 10 leading causes of death, and for most broad causes of death,  average annual costs per person for people who used residential aged care in their last year of life were lower than for those who did not use such care.