Suicides by age
Suicide rates by age
Ex-serving males and females
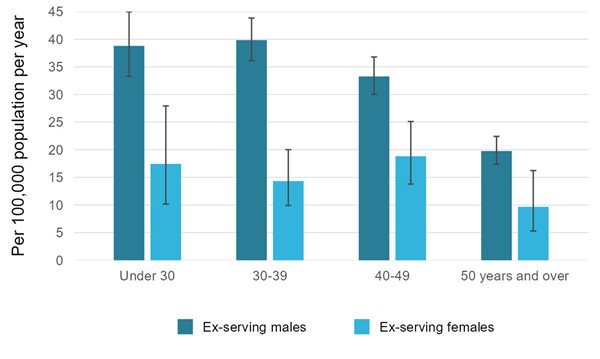
The suicide rates for both ex-serving males and females between 1997 and 2020 varied by age at time of suicide death.
Between 1997 and 2020, the suicide rate for ex-serving males aged 50 years and over was significantly lower than ex-serving males under 50 years of age (19.8 and 36.8 per 100,000 population per year). There was no statistical difference between any of the male age cohorts under 50 years of age.
There was no statistical difference between the ex-serving females suicide rates by age.
This is shown in Figure 5 below.
Figure 5: Suicide rate by age group, ex-serving males and females, 1997–2020
Source: AIHW analysis of linked Defence historical personnel data–PMKeyS–NDI data 1985–2020.
Suicide rates by age compared with the Australian population
The age-specific suicide rates for ex-serving males and females aged 50 years and over were similar to Australian males and females in the same age group. However, the age-specific suicide rates for ex-serving males and females were higher than the Australian population for all other age groups. For those under 30, the suicide rate was nearly three times higher for ex-serving females compared with Australian females, and almost twice as high for ex-serving males compared with Australian males.
The full set of values is given in Tables 3 and 4 below. As previously, comparisons are made here with the Australian population to provide context.
| Age group | Male ex-serving suicide rate (per 100,000 population per year) | Male Australian suicide rate(a) (per 100,000 population per year) | Significant difference to Australian population |
|---|---|---|---|
| Under 30 | 38.8 | 22.6 | Yes, Higher |
| 30-39 | 39.9 | 27.0 | Yes, Higher |
| 40-49 | 33.3 | 26.8 | Yes, Higher |
| 50 years and over | 19.8 | 20.9 | No |
Note:
- The age range for Australian males were matched to the ex-serving ADF males age range (minimum and maximum ages were 17 and 95 respectively).
Source: AIHW analysis of linked Defence historical personnel data–PMKeyS–NDI data 1985–2020; NMD 1985–2020.
| Age group | Female ex-serving suicide rate (per 100,000 population per year) | Female Australian suicide rate(a) (per 100,000 population per year) | Significant difference to Australian population |
|---|---|---|---|
| Under 30 | 17.4 | 6.3 | Yes, Higher |
| 30-39 | 14.3 | 7.4 | Yes, Higher |
| 40-49 | 18.8 | 7.8 | Yes, Higher |
| 50 years and over | 9.7 | 6.4 | No |
Note:
- The age range for Australian females was matched to the ex-serving ADF females age range (minimum and maximum ages were 17 and 90 respectively).
Source: AIHW analysis of linked Defence historical personnel data–PMKeyS–NDI data 1985–2020; NMD 1985–2020.
Suicide rate by age over time
There is some fluctuation over time in the suicide rates by age group, however most differences are not statistically significant.
Due to the small number of suicide deaths among ex-serving females, suicide rates by age over time are not reported.
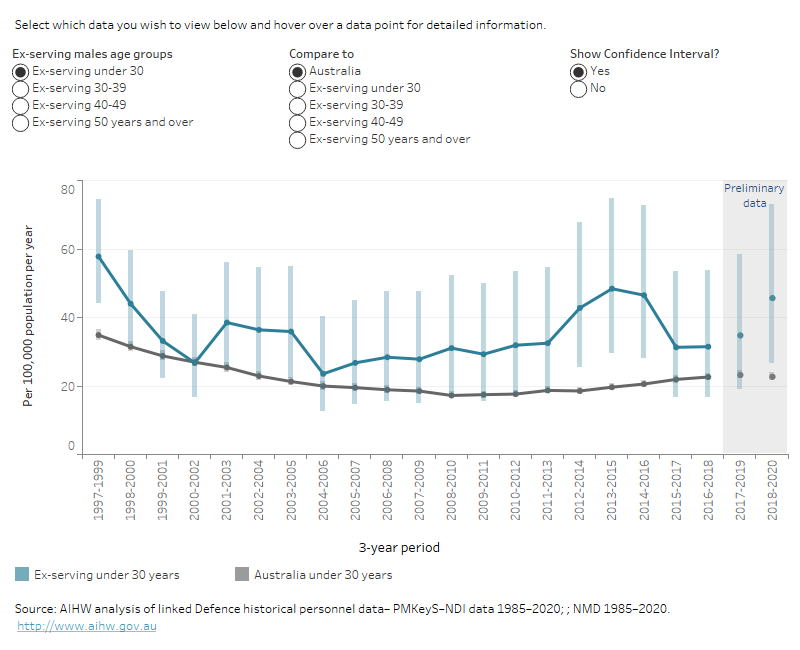
The suicide rate for ex-serving males, by age group, is compared with the rate for Australian males in the same age range in the interactive graph below (Figure 6). Select an age group from the menu to display the comparison.
There is some fluctuation over time in the suicide rates by age group, however most differences are not statistically significant.
Due to the small number of suicide deaths among ex-serving females, suicide rates by age over time are not reported.
The suicide rate for ex-serving males, by age group, is compared with the rate for Australian males in the same age range in the interactive graph below (Figure 6). Select an age group from the menu to display the comparison.
Figure 6: Rate of suicide, ex-serving and Australian males by age, 1997–1999 to 2018–2020
This time series line graph shows the weighted average suicide rate per 100,000 population per year of ex-serving and Australian males by age over time by 3-year periods from 1997 to 1999, to 2018 to 2020.
Notes:
The confidence intervals in this figure can be used to determine whether there is a statistically significant difference between the suicide rates calculated for the ADF between different 3-year periods. However, they cannot be used to determine whether there is a statistically significant difference between rates calculated for the ADF population for overlapping 3-year time periods (for example 2002–2004 and 2003–2005).
Minimum and maximum ages of Australian males were matched to the minimum and maximum ages of ADF ex-serving males for each year within 3-year periods.
Data underlying this graph are available in supplementary table S6.2 and S6.3. See Data for a link to the tables.
Please note, data for recent years are subject to change; see Technical notes for further detail.
Suicide rates by age and service status
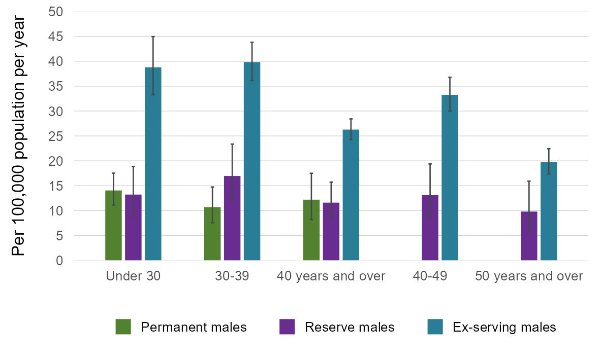
Permanent and reserve males’ suicide rates were similar regardless of their age at death (see Table 5 and Figure 7 below).
| Age group(a) | Permanent suicide rate (per 100,000 population per year) | Reserve suicide rate (per 100,000 population per year) | Ex-serving suicide rate (per 100,000 population per year) |
|---|---|---|---|
| Under 30 | 14.0 | 13.2 | 38.8 |
| 30-39 | 10.7 | 16.9 | 39.9 |
| 40 years and over | 12.2 | 11.6 | 26.3 |
| 40-49 | n.p. | 13.1 | 33.3 |
| 50 years and over | n.p. | 9.8 | 19.8 |
Notes
n.p. Not available for publication but included in totals where applicable, unless otherwise indicated. In this case this is a result of low numbers being potentially identifying.
- Due to the small number of suicide deaths among permanent males at the older ages, the upper age limit presented is 40 years and over.
Source: AIHW analysis of linked Defence historical personnel data–PMKeyS–NDI data 1985–2020
Due to low numbers of suicides among permanent males aged over 40, these values were aggregated into a single category (40 and over). The 40-49 and 50 and over figures are presented for reserve and ex-serving males.
Figure 7 below presents these values.
Figure 7: Male suicide rate by age group and service status, 1997–2020
Source: AIHW analysis of linked Defence historical personnel data–PMKeyS–NDI data 1985–2020.
Due to the small number of suicide deaths among females, suicide rates by age group and service status are not reported.
Data underlying this graph are available in supplementary table S4.1, S4.2, and S5.3. See Data for a link to the tables.
If you need help or support, please contact:
- Open Arms - Veterans and Families Counselling 1800 011 046
- Open Arms Suicide Intervention page
- Defence All-hours Support Line (ASL) 1800 628 036
- Defence Member and Family Helpline 1800 624 608
- Defence Chaplaincy Support 1300 333 362
- ADF Mental Health Services
- Lifeline 13 11 14
- Suicide Call Back Service 1300 659 467
- Beyond Blue Support Service 1300 22 4636
For information on support provided by DVA, see: