Characteristics of children on care and protection orders
On this page:
Children are counted in the state or territory where their order is operative, regardless of where the child lives.
Nationally, at 30 June 2021, about 61,700 children were on care and protection orders – a rate of 11 per 1,000 children (see Table 4.3 for numbers and rates across jurisdictions).
| State or territory | Number | Number per 1,000 |
|---|---|---|
| NSW | 20,414 | 11.4 |
| Vic | 14,898 | 10.5 |
| Qld | 12,515 | 10.5 |
| WA | 5,789 | 9.4 |
| SA | 4,814 | 13.0 |
| Tas | 1,385 | 12.3 |
| ACT | 917 | 9.5 |
| NT | 1,011 | 16.4 |
| Total | 61,743 | 10.9 |
Note: See Technical notes for the method used to calculate rates. For jurisdiction-specific footnotes, see Table 4.3 in the Child protection Australia 2020–21 data tables.
Sources: AIHW Child Protection Collection 2020–21; Table P1.
A majority of children were on finalised guardianship or custody orders
Of the approximately 61,700 children who were on care and protection orders at 30 June 2021, almost two-thirds (61% or 37,900) were on finalised guardianship or custody orders (Figure 4.5).
Figure 4.5: Children on care and protection orders, by type of order, 30 June 2021 (per cent)
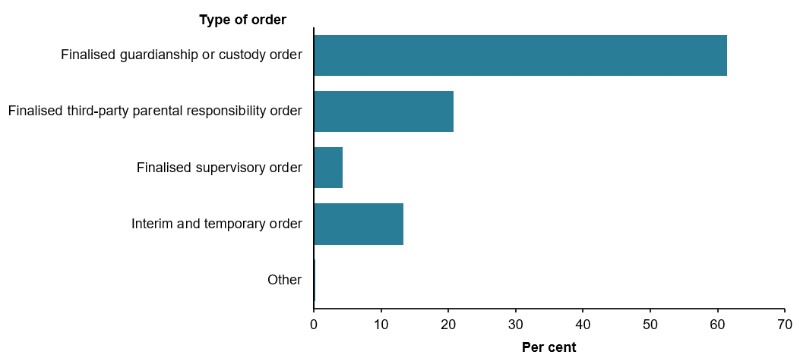
Chart: AIHW.
Source: Supplementary data table S4.10, AIHW Child Protection Collection 2020–21.
The type of order issued for each child depends upon many factors, such as the child’s age; alternative care options available; the severity of harm to the child; the time period associated with various protection orders and/or the likelihood of the child remaining in care or being reunited with their family.
Most children were placed with relative/kinship carers
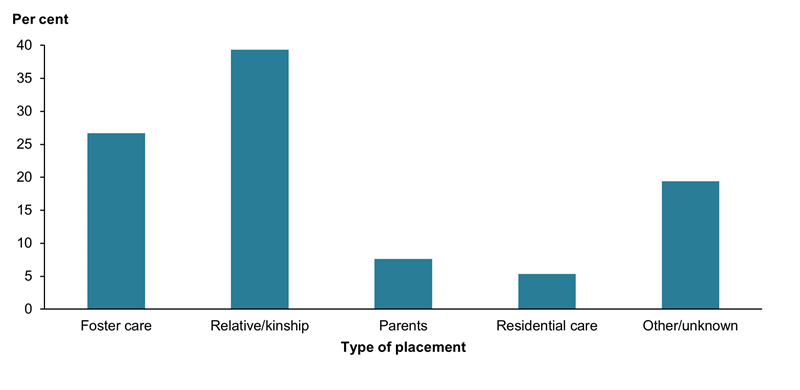
At 30 June 2021, the majority (66%) of children on care and protection orders were placed with relative/kinship carers (39%) or in foster care (27%).
Smaller proportions of children were placed with their parents (7.6%) or in residential care (5.3%) (Figure 4.6).
Figure 4.6: Children on care and protection orders, by type of placement, 30 June 2021 (per cent)
Note: Excludes some data for Tasmania due to small cell counts.
Chart: AIHW.
Source: Supplementary data table S4.5, AIHW Child Protection Collection 2020–21.
The type of placement of children on orders generally reflected their age. Across Australia:
- 98% of children on orders who were living independently were aged 15–17
- 88% of children on orders who were living in residential care were over 10 years old
- 91% of children on orders who were under 5 were living in family care or a home-based care placement (Supplementary table S4.6).
About two-thirds of children on orders were between 5 to 14 years old
Of the approximately 61,700 children on orders at 30 June 2021:
- 20% were aged under 5 (compared with 48% of children admitted to orders)
- 62% were aged 5–14
- 19% were aged 15–17 (Supplementary table S4.7).
The age distribution of all children on orders at 30 June 2021 was older than that for children admitted to orders during 2020–21. This reflects that the number of children on orders at 30 June includes children who were admitted during previous years and remained on an order in 2021 (supplementary tables S4.3 and S4.7).
Just over one-third of children on orders were Aboriginal and Torres Strait Islander children
At 30 June 2021, 39% (24,200) of children on care and protection orders were Indigenous. Of these children, 69% (16,700) were on guardianship or custody orders (Supplementary table S4.10).
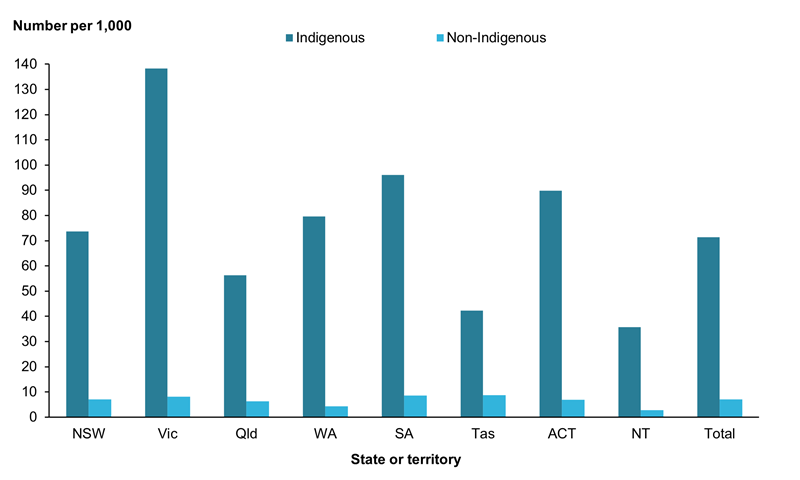
The rate of Indigenous children on orders nationally was 71 per 1,000. The rate of Indigenous children on care and protection orders was highest in Victoria (138 per 1,000), while the lowest rate was in the Northern Territory (36 per 1,000) (Figure 4.7).
Non-Indigenous children were on care and protection orders at a rate of 7 per 1,000. The rate of non-Indigenous children on care and protection orders was highest in South Australia and Tasmania (9 per 1,000) and lowest in the Northern Territory (3 per 1,000).
Figure 4.7: Children on care and protection orders, by Indigenous status and state or territory, 30 June 2021 (rate)
Note: See Technical notes for the method used to calculate rates.
Chart: AIHW.
Source: Supplementary data table S4.9, AIHW Child Protection Collection 2020–21.