How many children were on care and protection orders?
Data is reported for both the total number of care and protection orders issued in 2020–21, and the total number of children admitted to at least one care and protection order. A child may receive multiple care and protection orders over the course of a single year. Each order is counted separately, but a child is counted for only one admission/discharge during the year. As a result, the counts of orders issued are much higher than the counts of children admitted to care and protection orders.
About 45,500 care and protection orders were issued in 2020–21. Of these, most were interim and temporary orders (59% or 27,000) or finalised guardianship and custody orders (25% or 11,200).
The types of care and protection orders issued varied across jurisdictions, reflecting both the different types of orders available, and the different policies and practices putting them into effect (Figure 4.2). The relatively high proportion of interim and temporary orders is likely to be due to these orders being in place while children are the subjects of another order application going through the courts.
Figure 4.2: Care and protection orders issued, by type of order and state or territory, 2020–21 (per cent)
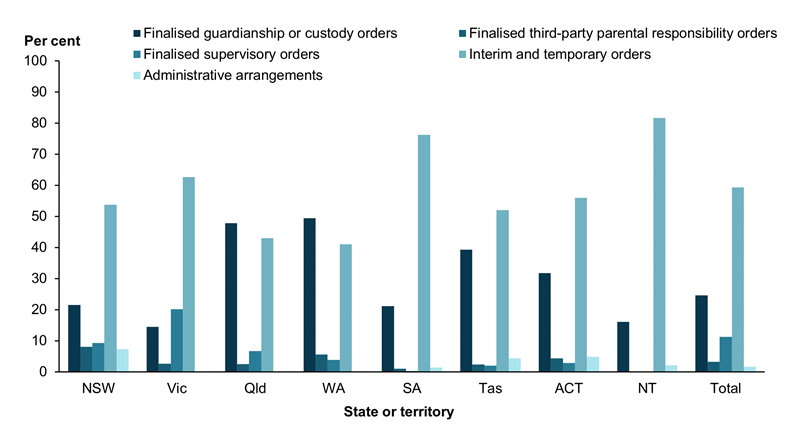
Note: Administrative arrangements are not applicable to Victoria and Queensland.
Chart: AIHW.
Source: Supplementary data table S4.1, AIHW Child Protection Collection 2020–21.
Almost half of children admitted to orders were aged under 5 years
In 2020–21, about 12,100 children were admitted to care and protection orders, three-quarters (76%) of whom were admitted for the first time (Table 4.2).
| State or territory | Children admitted to orders | Children admitted for the first time | First time admissions as a percentage of all order admissions (%) | Children discharged from orders |
|---|---|---|---|---|
| NSW | 2,246 | 1,919 | 85.4 | 2,391 |
| Vic | 4,564 | 3,231 | 70.8 | 4,615 |
| Qld | 2,934 | 2,257 | 76.9 | 2,306 |
| WA | 907 | 596 | 65.7 | 1,203 |
| SA | 819 | 744 | 90.8 | 561 |
| Tas | 308 | 137 | 44.5 | 360 |
| ACT | 125 | 110 | 88.0 | 112 |
| NT | 215 | 169 | 78.6 | 265 |
| Total | 12,118 | 9,163 | 75.6 | 11,813 |
Notes:
- Data include children who were discharged on their 18th birthday.
- For details on methodology used to count admissions and discharged from care and protection orders, see Technical notes. For jurisdiction-specific footnotes, see Table 4.2 in the Child protection Australia 2020–21 data tables.
Source: AIHW Child Protection Collection 2020–21.
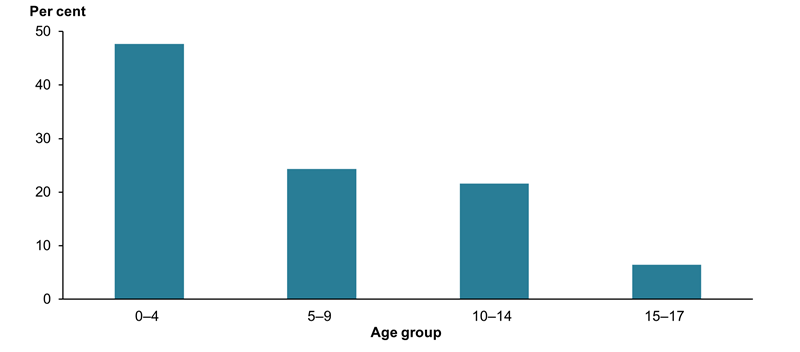
Almost half (48%) of children admitted to orders in 2020–21 were aged under 5 (Figure 4.3). This reflects the previously noted view that younger children are considered the most vulnerable.
Figure 4.3: Children admitted to care and protection orders, by age group, 2020–21 (per cent)
Note: For details on the methodology used to count admissions to care and protection orders, see Technical notes.
Chart: AIHW.
Source: Supplementary data table S4.3, AIHW Child Protection Collection 2020–21.
A majority of children who were discharged were continuously on an order between 1 to 2 years
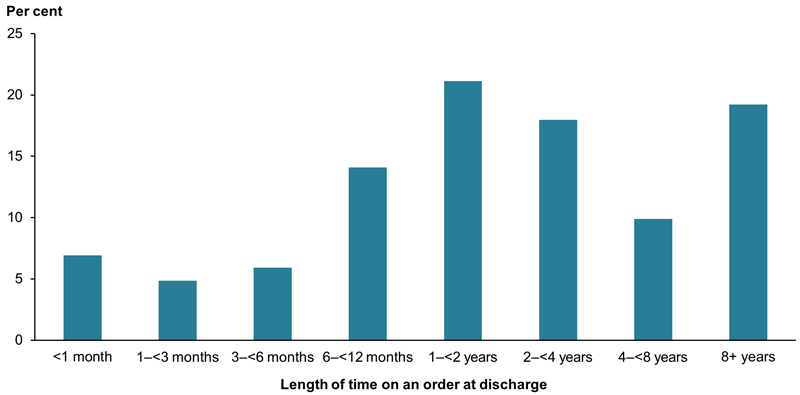
Of the approximately 11,800 children discharged from care and protection orders in 2020–21:
- 6.9% were continuously on an order for less than one month
- 4.8% were continuously on an order for 1 to 3 months
- 21% were continuously on an order for 1 to 2 years
- 19% were continuously on an order for 8 years or more (Figure 4.4).
Figure 4.4: Children discharged from care and protection orders, by length of time on an order, 2020–21 (per cent)
Note: For details on the methodology used to count discharges from care and protection orders, see Technical notes.
Chart: AIHW.
Source: Supplementary data table S4.4, AIHW Child Protection Collection 2020–21.
At the time of discharge, Indigenous children were most likely to have been continuously on an order for 8 or more years (23% or 900) and non-Indigenous children (23% or 1,800) were most likely to have been continuously on an order for 1 to 2 years (Supplementary table S4.4).