Has the number of children in out-of-home care changed over time?
Out-of-home care trend data have been back cast to 2016–17 with the national definition for out-of-home care adopted by all states and territories in 2018–19.
Data prior to 2018–19 may not match figures published elsewhere.
Between 30 June 2017 and 30 June 2021, the number of children in out-of-home care rose from 43,100 to 46,200.
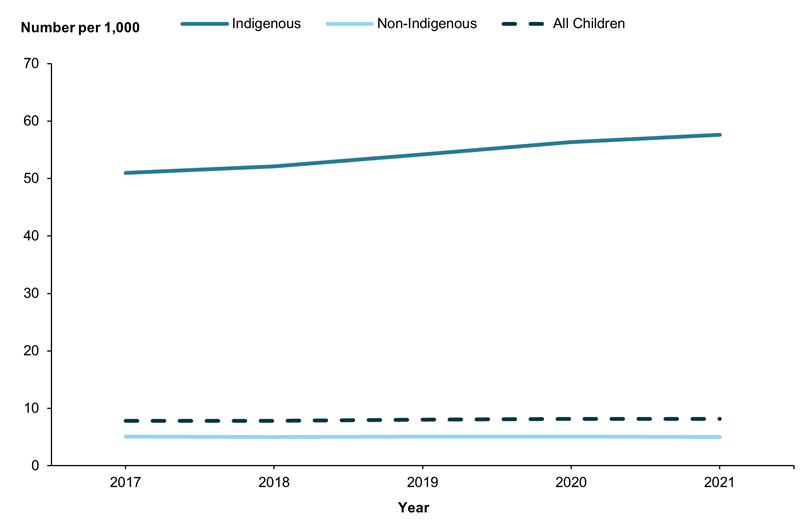
Nationally, the rate for children in out-of-home care has been relatively stable at 8 per 1,000 children from 30 June 2017 to 30 June 2021 (Supplementary table T2).
For state/territory trend data on the number and rate of children in out-of-home care between 30 June 2017 and 30 June 2021, see Table A1.
For Indigenous children in out-of-home care, rates rose between 2017 and 2021, from 51 per 1,000 children to 58 per 1,000 Indigenous children (Supplementary table T2).
For non-Indigenous children in out-of-home care, rates were stable at 5 per 1,000 non-Indigenous children from 2017 to 2021 (Figure 5.9).
Figure 5.9: Children in out-of-home care, by Indigenous status, 30 June 2017 to 30 June 2021 (rate)
Notes:
- In 2018–19, all states and territories adopted a national definition for out-of-home care and the out-of-home care data have been back cast to 2016–17 with the national definition. Due to data revisions, data for 2016–17 and 2017–18 may differ from those published elsewhere. Data should not be compared with data published in previous versions of Child protection Australia.
- See Technical notes for the methodology used to calculate rates.
Chart: AIHW.
Source: Supplementary data table T2, AIHW Child Protection Collection 2020–21.
Has there been a change in children admitted to, or discharged from, out-of-home care?
Between 2016–17 and 2017–18, the number of children admitted to out-of-home care fell by 3.4% (from around 11,600 to 11,300). This was followed by a rise of 10% over the following 2 years, to 12,300 in 2019–20. In 2020–21, this dropped by 6.7% to about 11,500 (supplementary tables S5.17 and S5.18).
The overall rate of admissions remained relatively stable over the same 5 years, at about 2 per 1,000 children.
The number of admissions has consistently outnumbered discharges – in 2020–21, 135 more children were admitted than were discharged (supplementary tables S5.18 and S5.20).
From 2016–17 to 2020–21, the rate of Indigenous children admitted to out-of-home care rose from 12 to 13 per 1,000 Indigenous children, with admissions in 2019–20 being slightly higher at 14 per 1,000. The rate of admissions for non-Indigenous children in the same period remained stable at 1 per 1,000 (Supplementary table S5.17).
The number of children discharged from out-of-home care rose from around 10,300 in 2016–17 to around 11,400 in 2020–21, with a slight drop in 2017–18.
Over the 5 years, the overall rate of children discharged was stable, at 2 per 1,000 children.
The rate of discharges for Indigenous children rose from 11 per 1,000 in 2016–17 to 12 per 1,000 in 2020–21, whereas the rate for non-Indigenous children was stable at 1 per 1,000 (Supplementary table S5.19).
Between 2016–17 and 2020–21, the rates of children aged 15–17 discharged from out-of-home care were consistently higher than for any other age group.