Housing-related needs
Home modifications
In 2018, 12% of people with disability were living in a dwelling that was modified to their needs, most often to install handrails or grab rails.
Safety and security in social housing
In 2021, 75% of social housing households with at least one person with disability had their home safety and security needs met.
Need to move house
In 2018, 8.6% of people with disability said they had to move house at some point in their life because of their condition or age.
On this page:
Introduction
People with disability may have specific housing-related needs. These can include modifying their dwelling, moving to more suitable accommodation, or moving closer to other services.
Data note
Data on this page are largely sourced from the Australian Bureau of Statistics (ABS) 2018 Survey of Disability, Ageing and Carers (SDAC). For more information about the SDAC, including the concepts of disability, disability severity, disability groups, and remoteness categories used by the SDAC, see ‘Data sources’.
Unless otherwise indicated, all data on this page refer to 2018.
Home modifications
Some people with disability may need modifications to buildings or fittings to help them move around or live with greater independence.
Of people living in private dwellings:
- 1 in 8 (12% or 511,000) with disability, and 1 in 4 (26% or 314,000) with severe or profound disability, have had modifications to their home because of their condition or age
- 1 in 5 (20% or 359,000) aged 65 and over with disability, and 2 in 5 (41% or 210,000) aged 65 and over with severe or profound disability, have done so
- those with disability aged under 25 (5.0% or 32,000) or 25–64 (7.0% or 124,000) are less likely to have done so than those aged 65 and over (20% or 359,000) (Table NEEDS.1).
Disability status | Under 25 | 25–64 | 65 and over | All ages |
|---|---|---|---|---|
Severe or profound disability | 8.5 | 19.9 | 40.6 | 25.5 |
Other disability | ** | 3.1 | 11.8 | 6.7 |
All with disability | 5.0 | 7.0 | 20.3 | 12.2 |
Notes:
** Estimate has a relative standard error greater than 50% and is considered too unreliable for general use.
- Data are for people with disability living in households.
Source: ABS 2019; see also Table NEED2, Data tables – Housing-related needs. View data tables
The percentage of people with disability living in private dwellings who have had modifications to their home varies by disability group:
- People with head injury, stroke or acquired brain injury are more likely to have modifications made to their home than any other disability group. One in 7 (14%, or 24,000) of those aged under 65 with disability caused by head injury, stroke or acquired brain injury and 38% (42,000) of those aged 65 and over have modifications made to their home.
- The age-related increase in home modifications is smallest for people with sensory or speech disability, and those with sensory or speech disability aged 65 and over are also least likely (21%, or 178,000) to have had modifications to their home compared with people aged 65 and over of any other disability group (Table NEEDS.2).
Disability group | Under 65 | 65 and over | All ages |
|---|---|---|---|
Sensory and speech | 8.5 | 20.8 | 16.0 |
Intellectual | 7.5 | 30.8 | 11.2 |
Physical restriction | 10.0 | 25.3 | 17.1 |
Psychosocial | 9.9 | 33.9 | 15.3 |
Head injury, stroke or acquired brain injury | 14.3 | 38.4 | 22.5 |
Other | 11.1 | 31.2 | 19.5 |
Note: Data are for people with disability living in households.
Source: ABS 2019; see also Table NEED4, Data tables – Housing-related needs. View data tables
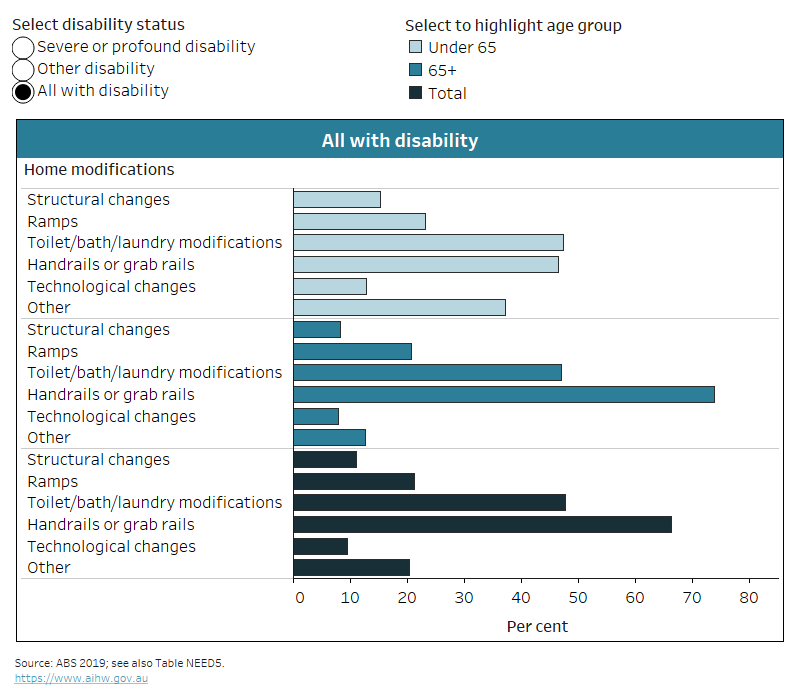
The most common types of home modifications are modifications to toilet, bath or laundry, installation of handrails or grab rails, and ramps. For those with disability whose home was modified:
- almost half of those aged under 65 (47% or 74,000) had the toilet, bath or laundry modified, and 47% (or 168,000) of those aged 65 and over
- almost half of those aged under 65 (46% or 72,000) had handrails or grab rails installed, compared with 3 in 4 (74% or 264,000) of those aged 65 and over
- 23% (or 36,000) of those aged under 65 had ramps installed, and 21% (or 74,000) of those aged 65 and over (Figure NEEDS.1).
Figure NEEDS.1: Types of home modifications, for people with disability whose home was modified, by disability severity and age group, 2018
This chart shows rates of common home modifications, such as handrails or grab rails (66% or people with disability whose dwelling was modified).
Notes:
* Relative standard error of 25–50% and should be used with caution.
- Data are for people with disability living in households whose dwelling has been modified because of their condition or age.
- People may have more than one type of modification in their home. Percentages will not add up to 100%.
- ‘Technological changes’ include remote controls, new or changed heating or air-conditioning, installed home automation / smart home or environmental control systems, and telemonitoring systems.
- ‘Other’ modifications include kitchen modifications, doors widened and other changes to dwelling.
Source data tables: Data tables – Housing-related needs. View data tables
In summary, whether a person with disability has their home modified, as well as types of modifications, varies by age and level of disability. For example:
- older people (aged 65 and over) with disability, and those with severe or profound disability, are the most likely to have their home modified (Table NEEDS.1)
- while handrails and grab rails are a common adjustment for all age groups, this modification is more common among older people (Figure NEEDS.1)
- some modifications (such as structural changes) are more often made for younger people (aged under 65) than for older people (aged 65 and over) (Figure NEEDS.1).
Satisfaction with home and neighbourhood
Data note
Data in this section are sourced from the 2021 Household, Income and Labour Dynamics in Australia (HILDA) Survey. For more information about HILDA, including the concepts of disability, disability severity, disability groups, and remoteness categories used by HILDA, see ‘Data sources’.
Satisfaction with home and neighbourhood
In 2021, HILDA Survey participants were asked to rate their satisfaction with the home they live in and their neighbourhood on a 0–10 scale. Ten represents the highest level of satisfaction and 0 the lowest (DSS and MIAESR 2022). In this analysis, people who indicate a satisfaction level between 0 and 5 are referred to as not satisfied with their home or neighbourhood, those who indicate a satisfaction level between 6 and 7 are referred to as somewhat satisfied, and those who indicate a satisfaction level between 8 and 10 are referred to as highly satisfied.
In 2021, about 1 in 9 (11%) people aged 15–64 with disability were not satisfied with their home, compared with 1 in 20 (5.3%) of those without disability. The levels of satisfaction with their home were similar for males and females, across different disability groups and levels of remoteness, but varied with severity of disability. People aged 15–64 with severe or profound disability were more likely (18%) to be not satisfied with their home than those with other disability status (9.6%) (DSS and MIAESR 2022).
People with disability aged 25–44 were the least likely to be highly satisfied with their home (60%), compared with those aged 65 and over (83%), and those aged 15–24 (75%) (DSS and MIAESR 2022). This pattern was similar to what was observed for people without disability.
People with disability aged 15–64 were more than twice as likely (13%) to be not satisfied with their neighbourhood as those without disability (5.9%). Among people with disability, there were no big differences in neighbourhood satisfaction for males and females, across disability groups or for people with severe or profound disability, nor by remoteness of the areas people with disability lived in. Those aged 65 and over, however, tended to be more satisfied with their neighbourhoods: 75% of people with disability in this age group were highly satisfied with their neighbourhood, compared with 59% of those aged 15–64 (DSS and MIAEST 2022).
Moving house
Data note
Data in this section are sourced from the 2021 Household, Income and Labour Dynamics in Australia (HILDA) Survey. For more information about HILDA, including the concepts of disability, disability severity, disability groups, and remoteness categories used by HILDA, see ‘Data sources’.
What is meant by moving house?
The HILDA Survey is collected every year from the same people, although not all people respond every year, and some new people are added to the survey. HILDA asks continuing respondents whether they have moved house since their last interview. It asks new respondents whether they have moved in the previous 12 months.
In 2021, 12% of people with disability said they had moved house in the previous year or since their last interview. Younger people with disability aged 15–24 or 25–34 were more likely (24% and 29%, respectively) to have moved house than those aged 55–64 (9.4%) or 65 and over (4.9%) (DSS and MIAESR 2022). This was similar for people without disability.
For people aged 15–64:
- 16% of those with disability had moved house in the previous year or since their last interview and 18% of those without disability
- those with disability living in Major cities were less likely (14%) to have moved than those in Inner regional areas (20%), or Outer regional, remote and very remote areas (19%)
- those with psychosocial disability (20%) were more likely to have moved than people with intellectual disability (12%)
- the reasons for moving were similar for people with and without disability, and included: family or lifestyle reasons (both 32% of people with disability who had moved), property no longer being available (17% of people with disability who had moved), to get a larger or better place (14%), and job or study (8.7%)
- just under a half (48%) of continuing respondents with disability who have moved house since their last interview moved less than 10km from their previous home, 1 in 3 (33%) moved between 10km and less than 100km, and 1 in 5 (19%) moved 100km or more (DSS and MIAESR 2022).
Need to move house
What is meant by need to move house?
The SDAC collects information on whether people living in households have ever needed to move house because of their condition or age.
In 2018, about 1 in 12 people with disability (8.6% or 358,000) said they had to move house at least once in their lifetime because of their condition or age. People with severe or profound disability (15% or 187,000) were more than twice as likely as people with other disability (5.8% or 172,000) to have done so. Younger people (aged under 65) with disability (8.2% or 197,000) were about as likely as older people (aged 65 and over) with disability (9.3% or 164,000) to have done so (Figure NEEDS.2).
Of the people with disability who had ever had to move house, 23% (or 82,000) had moved more than once: 24% (or 45,000) of those with severe or profound disability, and 21% (or 37,000) of those with other disability status (ABS 2019). People with disability aged under 65 were more likely to move more than once (32% of those who had to move, or 64,000) compared with those aged 65 and over (11% or 18,000) (ABS 2019).
People aged under 65 with psychosocial disability (15% or 119,000) or with disability caused by head injury, stroke or acquired brain injury (20% or 34,000) are more likely to have moved house because of their condition or age than those with sensory or speech disability (8.7% or 49,000), intellectual disability (9.7% or 52,000) or physical restrictions (11% or 146,000) (ABS 2019).
Figure NEEDS.2: People with disability who had ever have to move house due to their condition or age, by disability severity and age group, 2018
The chart shows that 8.6% of people with disability had to move house (15% with severe or profound disability and 5.8% with other disability status).

Note: Data are for people with disability living in households.
Source data tables: Data tables – Housing-related needs. View data tables
Needs in social housing
Data note
Data in this section are sourced from the 2021 National Social Housing Survey (NSHS). The NSHS is a biennial survey of social housing tenants. It complements administrative data collected by social housing providers and includes information on tenants and their social housing experiences.
Participants are randomly sampled from social housing programs – public housing, state owned and managed Indigenous housing, community housing, and Indigenous Community Housing.
How does NSHS define disability?
Households are said to have a person with disability if at least one member in the household always or sometimes needs assistance with self-care activities, body movement activities or communication, and the reason they need assistance is ‘long-term health condition lasting 6 months or more’ or ‘disability’.
Proximity to services
Being able to access services, such as medical centres or public transport, is important for better health, social and economic outcomes. Compared with other social housing households, those that have at least one person with disability are less likely to have their needs for access to services and facilities met (Table NEEDS.3).
Services and facilities | Person with disability in household | No person with disability in household |
|---|---|---|
Shops and banking | 86.3 | 94.9 |
Public transport | 92.1 | 95.6 |
Parks and recreational or sporting facilities | 92.3 | 95.4 |
Medical services | 88.9 | 95.2 |
Hospitals | 91.1 | 95.5 |
Child care facilities | 90.0 | 94.7 |
Schools | 93.9 | 96.4 |
TAFE, university or other training | 80.4 | 92.8 |
Employment / place of work | 81.7 | 92.7 |
Community and support services | 85.8 | 94.9 |
Family and friends | 80.5 | 90.9 |
Source: AIHW 2022, Table S4.3.
Home amenities
Social housing households that have at least one person with disability are less likely than those without disability to say that their needs are met for a range of housing amenities, including:
- structural modifications for special needs (72% compared with 83%)
- fixtures for special needs (75% compared with 85%)
- energy efficiency (69% compared with 81%) and thermal comfort (66% compared with 77%)
- safety and security, whether in the home (75% compared with 83%) or in the neighbourhood (70% compared with 78%)
- ease of access and entry (90% compared with 96%) (AIHW 2022).
ABS (Australian Bureau of Statistics) (2019) Microdata: Disability, ageing and carers, Australia, 2018, ABS cat. no. 4430.0.30.002, ABS, AIHW analysis of TableBuilder data, accessed 15 April 2021.
AIHW (Australian Institute of Health and Welfare) (2022). National Social Housing Survey 2021, AIHW, accessed 12 September 2023.
DSS (Department of Social Services) and MIAESR (Melbourne Institute of Applied Economic Social Research) (2022) The Household, Income and Labour Dynamics in Australia (HILDA) Survey, General Release 21, wave 21, doi:10.26193/KXNEBO, ADA Dataverse, V3, AIHW analysis of unit record data, accessed 7 December 2022.