Impact of COVID-19
Page highlights:
- An unusually high volume of cardiovascular disease scripts was dispensed in March 2020 (10.0 million), coinciding with the introduction of lockdowns and public health restrictions.
Emergency department presentations
- Presentations fell by almost one quarter (23%) between January and April 2020.
- Cardiovascular disease hospitalisations declined by one quarter (24%) from March to April 2020.
- Coronary heart disease mortality continued its historical decline in 2020, the first year of the pandemic, but has since increased – the number of deaths in 2022 being 9.1% higher than the number in 2020.
The COVID-19 pandemic has greatly affected Australia’s population and health-care system. Cardiovascular disease (CVD) is one of many conditions impacted directly by COVID-19, as well as by the restrictions and changes affecting health care provision which commenced in February 2020 (Zaman et al. 2020, Nadarajah et al. 2022).
Compared with people with no existing CVD, people with existing CVD have a higher risk of cardiac complications from COVID-19 (Pellicori et al. 2021). They have an increased risk of hospitalisation, intensive care admission, poorer health outcomes and death.
People with COVID-19 are at increased risk of acute cardiac injury, heart failure, arrhythmias and acute coronary syndromes (Xie et al. 2022, Hessami et al. 2021). In rare cases, COVID-19 vaccines can cause myocarditis or pericarditis (Department of Health and Aged Care 2022a).
This web page explores some of the aspects of the impact of COVID-19 on people with CVD using national data available across the COVID-19 pandemic period. Note that COVID-19 lockdowns in different jurisdictions at different times will also affect the national total.
Health service use
People living with CVD require regular contact with GPs, medical specialists and allied health services to manage their condition(s). As part of restrictions introduced to deal with COVID-19, some health services were suspended or were required to operate in new or different ways. Adaptive health care delivery models, such as telehealth consultations, and revised resource allocations were needed to help address the needs of CVD patients during COVID-19 (Zaman et al. 2020, Nadarajah et al. 2022).
Care for stroke is one example. The first wave of the pandemic in 2020 negatively impacted access to specialised stroke units in hospitals, with fewer resources available for treatment, leading to concerns about reduced quality of care for patients with stroke (Cadilhac et al. 2022). The impact of diverted resources has been sustained beyond the first wave of the pandemic (Stroke Foundation 2021).
Primary health care
MedicineInsight is a database containing de-identified electronic health records from around 450 Australian general practices. From this data, a series of annual General Practice Insights Reports are released. The data allows exploration of whether the COVID-19 pandemic decreased the likelihood that a patient with a chronic condition such as CVD would visit their GP.
The general pattern in the monthly number of clinical encounters was similar in 2019 and 2020 (NPS MedicineWise 2022). The rate of presentations per 1,000 clinical encounters for patients with a history of CVD also showed little variation over 2019 and 2020. There was no substantial difference when each quarter in 2020 was compared to the corresponding quarter in 2019:
- 27 CVD patients per 1,000 clinical encounters in Quarter 2 of 2020, compared with 28 in Quarter 2 of 2019
- 6.1 heart failure patients per 1,000 clinical encounters in Quarter 2 of 2020, compared with 6.2 in Quarter 2 of 2019.
One factor as to why that rate was unchanged is the rapid uptake of telehealth services via phone or video conferencing in April 2020 after the introduction of temporary MBS items in response to COVID-19 lockdown restrictions (NPS MedicineWise 2022, Department of Health and Aged Care 2022b).
Heart Health Checks were affected by the pandemic. Nationally, the total number of services processed fell to 2,900 per month in April 2020, compared with a monthly average of 7,200 for that year (Figure 1). Monthly averages have since increased to 8,400 in 2021, and 10,000 in January–July 2022, noting that this includes an end-of-year fall to 4,800 in January 2022 which coincided with the Omicron wave of the pandemic.
Figure 1: Heart Health Checks processed by Medicare Australia, April 2019–July 2022
The line chart shows that the number of Heart Health Checks processed by Medicare fell to 2,900 in April 2020, compared with a monthly average of 7,200 for that year, and 4,800 in January 2022, compared with a monthly average of 10,000 for January–July 2022.

Medicine use
Analysis of the total volume of PBS scripts for ATC group C, Cardiovascular system dispensed during 2020 shows little change from 2019. During 2019, 97.4 million CVD scripts were dispensed, compared with 102.0 million for 2020 (AIHW 2022b).
There were, however, changes in consumer behaviour. An unusually high volume of CVD scripts was dispensed in March 2020 (10.0 million), coinciding with the introduction of lockdowns and public health restrictions, followed by a decrease in April 2020 (7.3 million) (AIHW 2020).
In March 2020, the Australian Government implemented temporary changes to medicines regulation to support Australians’ continued access to PBS medicines during the COVID-19 pandemic. Some of these changes were in response to the dramatic increase in demand for medicines during early March, which resulted in pharmacies and wholesalers reporting medicine shortages.
The measures included a restriction on the quantity of medicines purchased to discourage unnecessary medicine stockpiling, continued dispensing emergency measures to allow one month supply of a patient’s usual medicines without a prescription, a home delivery service for eligible patients, digital image-based prescriptions to support telehealth medical services, and arrangements for medicine substitution by pharmacists without prior approval from the prescribing doctor (AIHW 2020).
Pathology
Numbers of Medicare claims for several CVD-related pathology tests fell during the early months of the COVID-19 pandemic following the introduction of lockdowns, and then returning to pre-COVID-19 levels (Table 1):
Medicare item | Feb 2020 | Mar 2020 | Apr 2020 | May 2020 | Jun 2020 |
|---|---|---|---|---|---|
66503, Lipid studies | 35,032 | 36,054 | 23,364 | 29,067 | 36,243 |
66518, Cardiac enzymes or cardiac markers | 33,845 | 33,738 | 26,484 | 30,362 | 35,181 |
66536, Quantitation of HDL cholesterol | 146,796 | 144,972 | 91,590 | 117,631 | 144,720 |
Source: Services Australia 2022.
The MedicineInsight General Practice Insights Reports shows similar findings. Recorded result rates per 1,000 clinical encounters fell sharply for many pathology tests – including total cholesterol – in April 2020 (NPS MedicineWise 2022):
- 54 total cholesterol results per 1,000 clinical encounters in April 2020, compared with 108 in February 2020
Testing rates for total cholesterol rose from May 2020 onwards but plateaued again in July 2020 at 90 per 1,000 clinical encounters, the time of the second COVID wave in Victoria (NPS MedicineWise 2022).
Emergency department presentations
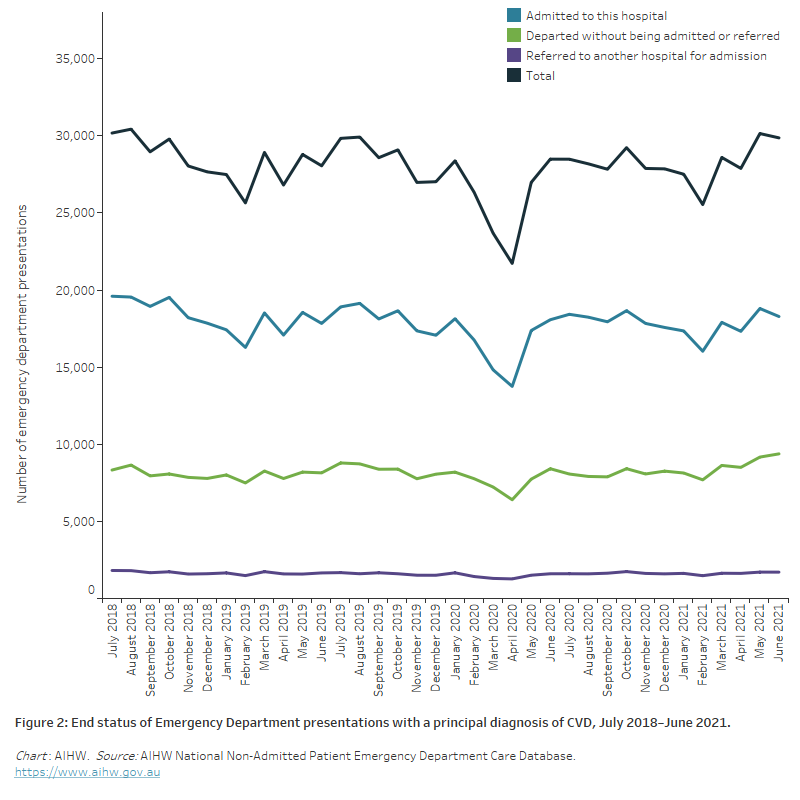
The number of presentations to emergency departments with a principal diagnosis in the Cardiovascular body system fell substantially during the early stages of the COVID-19 pandemic (Figure 2).
Presentations fell by almost one quarter (23%) between January and April 2020 (28,400 to 21,700), leading to declines in admissions to hospital, in referrals to other hospitals for admission and in departures without admission or referral.
Figure 2: End status of Emergency Department presentations with a principal diagnosis of CVD, July 2018–June 2021
The line chart shows a fall of one quarter (23%) in Emergency Department presentations between January and April 2020 (28,400 to 21,700), leading to declines in admissions to hospital, in referrals to other hospitals for admission and in departures without admission or referral.
Hospitalisations
Hospitalisations with a principal diagnosis of CVD fell sharply between March and April 2020, when lockdown measures were introduced nationwide by the Australian Government:
- a decline of one quarter (24%) from March to April 2020 (45,700 to 34,600)
- a decline of 26% when comparing April 2019 with April 2020 (46,600 to 34,600) (Figure 3).
Note that Figure 3 presents the national number of hospitalisations and may be varied across time and across state and territories.
Figure 3: Hospitalisations with cardiovascular disease as a principal diagnosis, by sex, July 2017–June 2021
The line chart shows that hospitalisations with a principal diagnosis of CVD fell sharply for both males and females between March and April 2020, when lockdown measures were introduced nationwide by the Australian Government.

Comorbidity of COVID-19 and CVD
In 2020–21, there were over 4,700 hospitalisations in Australia that involved a COVID-19 diagnosis (AIHW 2022c).
The most common comorbid conditions associated with COVID-19 hospitalisations over this period were CVD (20%) and type 2 diabetes (20%).
Of those COVID-19 hospitalisations with comorbid diagnosis of CVD in 2020–21:
- 18% involved time spent in an Intensive Care Unit (ICU)
- 12% involved Continuous ventilatory support
- 20% had a separation mode indicating the patient died in hospital.
Procedures
Hospital procedures for CVD – including coronary angiography, percutaneous coronary interventions (PCIs) and coronary artery bypass grafting (CABG) – were variably affected by the COVID pandemic:
- coronary angiographies fell by 27% from 11,600 in March 2020 to 8,400 in April 2020. In April 2019, 11,400 coronary angiographies were performed
- PCI fell by 19% from 3,850 in March 2020 to 3,120 in April 2020. In April 2019, 3,700 PCIs were performed
- CABG fell by 15% from 1,100 in March 2020 to 940 in April 2020. In April 2019, 1,040 CABGs were performed (Figure 4).
Proportionally, the decline from March to April 2020 in the number of coronary angiographies performed (27%) was greater than the declines in PCI (19%) and CABG (15%). Coronary angiography is a diagnostic procedure, whereas PCI and CABG are medical procedures for treating blocked or narrowed coronary arteries. The number of procedures during the COVID pandemic may have impacted by changing clinical recommendations to minimise exposure risk to patients, based on severity and clinical judgement, to reduce length of stay and time spent in ICU (Zaman et al. 2020).
Figure 4: Selected hospital procedures for cardiovascular disease, July 2018–June 2021
The line chart shows that the number of coronary angiographies performed declined between March and April 2020, as restrictions were applied to selected elective surgeries. There were smaller declines for percutaneous coronary interventions (PCIs) and coronary artery bypass grafts (CABG).

Elective surgery
Following a decision by National Cabinet to ensure that the health system maintained adequate capacity to deal with the COVID-19 pandemic, restrictions were applied to selected elective surgeries from 26 March 2020. These restrictions were gradually eased from 29 April 2020 onwards, although further restrictions applied in some areas in later periods as part of the response to further COVID-19 outbreaks (AIHW 2022a).
Waiting times
Waiting times for most intended procedures increased between 2019–20 and 2020–21. One of the greatest increases in median waiting times occurred for varicose veins treatment (94 days, from 129 days in 2019–20 to 223 days in 2020–21), second only to tonsillectomy (123 days) (AIHW 2022a). The mean waiting time for haemorrhoidectomy rose from 57 to 70 days. Waiting times stayed constant for coronary artery bypass graft (18 days).
The proportion of patients waiting more than 365 days for their elective surgery also increased between 2019–20 and 2020–21:
- vascular surgery (1.2% to 4.1%) – including haemorrhoidectomy (1.9% to 6.0%), and varicose veins treatment (6.6% to 19.8%)
- cardio-thoracic surgery (0.1% to 0.5%) (AIHW 2022a).
Admissions from waiting lists
Admissions from waiting lists for elective surgery between 2019–20 and 2020–21:
- fell by 4.4% for cardio-thoracic surgery (11,499 to 10,993) – including a fall of 12% for coronary artery bypass graft (3,073 to 2,713)
- rose by 5.6% for vascular surgery (16,551 to 17,471) – including increases of 12% for haemorrhoidectomy (3,955 to 4,422) and 15% for varicose veins treatment (2,732 to 3,148) (AIHW 2022a).
Increases in admissions from waiting lists in 2020–21 were likely due to the lifting of restrictions in place for certain elective surgeries during 2019–20 in response to COVID-19. Many jurisdictions implemented programs to fast-track elective surgeries and provided increased funding for surgeries which were delayed because of the restrictions.
Deaths
Australia recorded significantly lower-than-expected mortality for the country during 2020, the first year of the COVID-19 pandemic. There were decreases across key causes – most notably, deaths from respiratory disease including influenza. Measures put in place to prevent the spread of COVID-19 can also reduce the spread of other communicable diseases. The total mortality rate remained low during 2021 with the top 5 leading causes of death unchanged and coronary heart disease (CHD) at the top of the list (ABS 2022b).
However, by 2022, the third year of the pandemic, Australia had recorded a 15% increase in the total number of deaths, compared to the historical average (ABS 2023a).
Since the commencement of the pandemic, a total of 16,400 people have died with or from COVID-19 (ABS 2023b).
Cardiovascular disease deaths during COVID
Australian Bureau of Statistics (ABS) provisional mortality statistics indicate that there were:
- 13,700 doctor-certified deaths due to CHD during 2020, rising to 14,100 in 2021 and 14,900 in 2022
- 9,100 doctor-certified deaths due to cerebrovascular diseases (including stroke) during 2020, rising to 9,300 in 2021 and 9,300 in 2022 (ABS 2023a).
CHD mortality continued its historical decline in 2020, the first year of the pandemic, but has since increased – the number of deaths in 2022 being 9.1% higher than the number in 2020.
The increase in cerebrovascular disease deaths also reverses a historical decline, but has been more moderate with the number of deaths in 2022 being 2.2% higher than in 2020.
Note that these data are preliminary, with some deaths that occurred in 2022 not yet registered. In addition, causes of death were not presented for coroner-referred deaths due to the time required to complete coronial investigations (ABS 2023a).
Cardiovascular disease associated with COVID-19 deaths
Most COVID-19 deaths (96%) have other conditions listed on the death certificate (either pre-existing or conditions caused by COVID-19 and its complications):
- chronic cardiac conditions – including coronary atherosclerosis, cardiomyopathies and atrial fibrillation – were the most documented comorbidities, present in 40% of the 10,600 COVID-19 deaths registered until 28 February 2023 that had a pre-existing chronic condition reported on the death certificate. Other CVD-related comorbidities included hypertension (13%) and chronic cerebrovascular diseases (4.1%)
- acute cardiac complications caused by COVID-19 were reported in 9.7% of the 9,300 COVID-19 deaths registered until 28 February 2023 that had a causal sequence described on the death certificate (ABS 2023b).
COVID-19 associated with cardiovascular disease deaths
There were 3,222 people who died with COVID-19 as an associated cause of death until 28 February 2023, rather than directly from the virus itself. Of these, circulatory system diseases (24%) were the second most common underlying cause of death, behind cancer (27%). CHD was the most common cause of circulatory system disease for those people who died where COVID-19 was an associated cause of death (ABS 2023b).
ABS (Australian Bureau of Statistics) (2022a) Household Impacts of COVID-19 Survey, February 2022, ABS, Australian Government, accessed 18 August 2022.
ABS (2022b) Causes of death, Australia, ABS, Australian Government, accessed 25 October 2022.
ABS (2023a) Provisional Mortality Statistics, ABS, Australian Government, accessed 31 March 2023.
ABS (2023b) COVID-19 mortality in Australia: Deaths registered until 28 February 2023, ABS, Australian Government, accessed 31 March 2023.
AIHW (2020) Impacts of COVID-19 on Medicare Benefits Scheme and Pharmaceutical Benefits Scheme service use, AIHW, Australian Government.
AIHW (2022a) Elective surgery, AIHW, Australian Government, accessed 19 August 2022.
AIHW (2022b) Impacts of COVID-19 on Medicare Benefits Scheme and Pharmaceutical Benefits Scheme: quarterly data, AIHW, Australian Government, accessed 19 August 2022.
AIHW (2022c) MyHospitals. Admitted patient activity, AIHW, Australian Government, accessed 23 August 2022.
Cadilhac DA, Kim J, Cloud G, Anderson CS, Tod EK, Breen SJ et al. on behalf of the AuSCR COVID-19 Reporting Consortium Group (2022) ‘Effect of the Coronavirus Disease 2019 pandemic on the quality of stroke care in stroke units and alternative wards: a national comparative analysis’, Journal of Stroke, 24:79–87, doi:10.5853/jos.2021.02530.
Department of Health and Aged Care (2022a) COVID-19 vaccines and cardiac inflammation, Department of Health and Aged Care website, accessed 6 October 2022.
Department of Health and Aged Care (2020b) Providing health care remotely during the COVID-19 pandemic, Department of Health and Aged Care website, accessed 25 August 2022.
Hessami A, Shamshirian A, Heydari K, Pourali F, Alizadeh-Navaei R, Moosazadeh M et al. (2021) ‘Cardiovascular disease burden in COVID-19: systemic review and meta-analysis’, American Journal of Emergency Medicine, 46: 382–391, https://doi.org/10.1016/j.ajem.2020.10.022.
Nadarajah R, Wu J, Hurdus B, Asma S, Bhatt DL, Biondi-Zoccai G et al. (2022) ‘The collateral damage of COVID-19 to cardiovascular services: a meta-analysis’ European Heart Journal, 43:3164–3178, https://doi.org/10.1093/eurheartj/ehac227.
NPS MedicineWise (2022) MedicineInsight General practice insights report, July 2019– June 2020 including analysis related to the impact of COVID-19, NPS MedicineWise, accessed 25 August 2022.
Pellicori P, Doolub G, Wong CM, Lee KS, Mangion K, Ahmad M et al. (2021) ‘COVID-19 and its cardiovascular effects: a systematic review of prevalence studies’, Cochrane database of systematic reviews, https://doi.org/10.1002/14651858.CD013879.
Services Australia (2022) Medicare item reports, Services Australia, Australian Government, accessed 29 August 2022.
Stroke Foundation (2021) National Stroke Audit – Acute Services Report 2021, Stroke Foundation, accessed 7 September 2022.
Xie Y, Xu E, Bowe B and Al-Aly Z (2022) ‘Long-term cardiovascular outcomes of COVID-19’, Nature Medicine, 28:583–590, https://doi.org/10.1038/s41591-022-01689-3.
Zaman S, MacIsaac AI, Jennings GLR, Schlaich MP, Inglis SC et al. (2020) ‘Cardiovascular disease and COVID-19: Australian and New Zealand consensus statement’, Medical Journal of Australia, 213:182–187, doi.org/10.5694/mja2.50714.