Introduction
On this page:
What is social housing?
Social housing is low cost or subsidised rental housing provided to eligible Australians by government or non-government (including not-for-profit) organisations. In recent times, social housing has increasingly been provided to those in ‘greatest need’ relative to others on the waiting list, for example, those experiencing homelessness, family or domestic violence, or those with disability or special needs. For more information see the Entries, exits and transfers and Supply of social housing in Housing assistance in Australia.
In 2020–21, there were almost 790,000 people living in over 440,000 social housing dwellings across Australia. The 3 main Australian social housing programs relevant to the National Social Housing Survey are public housing, state owned and managed Indigenous housing (SOMIH) and community housing (Figure Intro.1). For more information on demographics of people in social housing, see the Occupants and Households sections of Housing assistance in Australia.
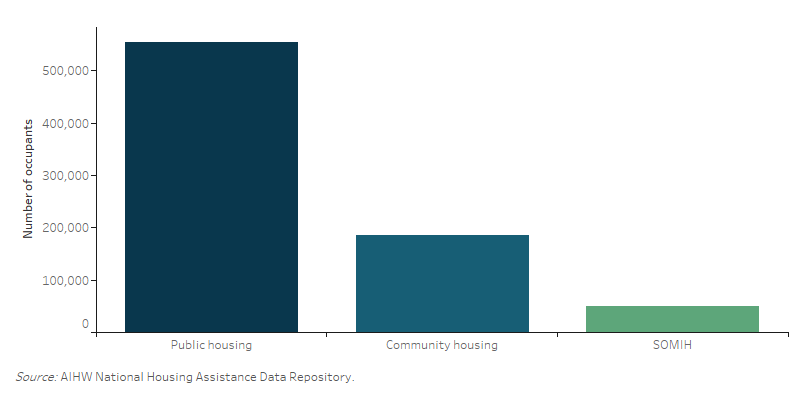
Figure Intro.1: Australians living in the 3 main social housing programs, 2020–21
This bar chart shows that in 2020–21, public housing had around 554,700 occupants, followed by community housing with around 185,800 and SOMIH with 49,500.
The impact of housing on health and wellbeing
Housing is more than simply shelter. Housing can shape the health and wellbeing of Australians. Where people live and the condition of their housing can have far-reaching impacts on their health, as well as the quality of life enjoyed—or endured (Fujiwara 2013; Marmot et al, 2012).
Housing conditions relate to the physical characteristics and quality of the dwelling, such as its structure, facilities and amenities. Housing conditions influence various aspects of health, including mental and physical health, and respiratory and cardiovascular disease risk. For example, living in a cold, mouldy and damp home can increase the risk of respiratory diseases (Wimalasena et al. 2021). Living in persistently inadequate housing is associated with worsening mental health (Pevalin et al. 2017; Singh et al. 2019).
Housing location relates to the environmental characteristics affecting the lifestyle and experiences afforded to tenants, such as their access to transport, shops and friends and family. As such, it can affect people’s wellbeing and lives. For example, housing location can affect who they can socialise with, where they can work, what schools they can attend and which services they can reasonably access (Ong et al. 2022; Paddison et al. 2012; Phibbs and Thompson 2011).
In this way, housing can have a dramatic bearing on people’s health and wellbeing through such domains as education, earnings, social/community engagement, exposure to disease, healthcare access and of course, life itself (Clapham et al. 2017).
For more information on housing and wellbeing indicators, such as affordability, see Australia’s welfare indicators.
About the National Social Housing Survey (NSHS) 2021
The NSHS is the largest social housing study conducted in Australia and complements other data on social housing in Australia, that is, administrative data collected by social housing providers and reported in Housing assistance in Australia.
The primary objective of the NSHS is to gain insights into the lived experiences of social housing tenants and their satisfaction with housing service providers, amenities, and maintenance services, as well as tenants’ perceived benefits of living in social housing. NSHS offers tenants’ perspectives on social housing to allow for a more person-centred approach to the Australian social housing experience. The findings on the lived experiences of social housing tenants assist in understanding tenant needs and whether housing policy objectives are being fulfilled.
Social housing households from all states and territories were sampled in the NSHS. Information on the housing programs covered in each jurisdiction is outlined in Table Intro.1.
|
|
NSW |
Vic |
Qld |
WA |
SA |
Tas |
ACT |
NT |
|---|---|---|---|---|---|---|---|---|
|
State/territory has PH |
Y |
Y |
Y |
Y |
Y |
Y |
Y |
Y |
|
PH in‑scope for 2021 NSHS |
Y |
Y |
Y |
Y |
Y |
Y |
Y |
Y |
|
State/territory has SOMIH |
Y |
N |
Y |
N |
Y |
Y |
N |
Y |
|
SOMIH in‑scope for 2021 NSHS |
Y |
. . |
Y |
. . |
Y |
Y |
. . |
N |
|
State/territory has CH |
Y |
Y |
Y |
Y |
Y |
Y |
Y |
Y |
|
CH in‑scope for 2021 NSHS |
Y |
Y |
Y |
Y |
Y |
Y |
Y |
N |
Y - yes
N - no
. . - not applicable
The 2021 NSHS is the most recent in a series of surveys of social housing tenants. The previous NSHS was undertaken in 2018 and while the NSHS is ordinarily undertaken every 2 years, the 2020 survey was delayed due to COVID-19. The survey was administered between April and September 2021.
The impact of COVID-19 affected several aspects of the NSHS survey including:
- survey delivery mode (less face–to–face interviews were able to be carried out)
- Indigenous Community Housing tenants were not surveyed. In 2018, Indigenous Community Housing tenants in Queensland were surveyed for the first time.
- delayed postage (impacted timeliness and survey follow up).
Lonergan Research administered and conducted the survey on behalf of the AIHW. Social housing tenants were randomly selected based on the demographic characteristics of each program by state. Participating tenants completed the survey form either on paper, online, face–to–face or over the telephone. Detailed information on the impact of COVID-19 and other information on the survey implementation are detailed in the methodological report.
Additional questions were incorporated regarding COVID-19 and its impact on social housing. More detail is provided in the COVID-19 section of this report.
Information on the number of survey responses received for each social housing program is outlined in the box below, with more information in the supplementary tables.
2021 NSHS Sample Information
A total of 8,976 NSHS questionnaires were completed in 2021:
- 8,443 via mail-out or online
- 4,556 by public housing tenants
- 837 by SOMIH tenants
- 3,050 by community housing tenants
- 533 were face-to-face interviews with SOMIH tenants (NSW).
Understanding tenant satisfaction statistics
The key findings from the 2021 NSHS are presented in this report. The descriptive statistics presented are proportions (per cent) obtained by applying weights to the NSHS sample responses. That is, not every social housing household was surveyed so statistical methods (weighting) was used to ensure that estimates better represent all tenants in social housing, rather than just those who were surveyed.
Results of logistic regression analyses are also presented to provide an insight into the factors most closely associated with tenant satisfaction. Regression analysis is a statistical technique used to explore the relationships between factors (or variables) and an outcome.
In some instances, where appropriate, the results from 2014, 2016, and 2018 are used for comparisons. More detailed data are available in the supplementary data tables. More information on the NSHS statistical methodology (such as sampling and weighting), is provided in the technical notes.
Are observed differences statistically significant and what does that mean in this report?
Tests of statistical significance compare observed data to a hypothesised data model, gauging the compatibility between what has been observed and the hypothesis. Under the hypothesis, the chance of obtaining data as or more incompatible as the observed data are calculated. If this probability is below a given threshold, the result is declared to be statistically significant. Statistical significance does not imply a difference is big, meaningful, or important. Here, the term ‘significantly’ refers to statistically significant results which are explicitly described or highlighted as such throughout this report.
Significance is affected by the number of people sampled. When there is a large enough number of people in a sample, even very small differences can be statistically significant, whereas large changes can be missed when a small number of people are sampled.
Readers are encouraged to consult the confidence interval data tables when interpreting differences in estimates between populations or over time. A confidence interval is statistical term describing a range (interval) of values that covers the true population value with a known confidence. The confidence level used in this report is 95%.
Clapham D, Foye C and Christian J (2017) ‘The concept of subjective well-being in housing research’, Housing, Theory and Society, 35(3):261-280.
Fujiwara D (2013) ‘The Social Impact of Housing Providers’, HACT, London.
Marmot M, Allen J, Bell R, Bloomer E and Goldblatt P (2012). ‘WHO European review of social determinants of health and the health divide’, The Lancet, 380(9846):1011-1029.
Ong R, Singh R, Baker E, Bentley R and Hewton J (2022) ‘Precarious housing and wellbeing: a multidimensional investigation’, AHURI Final Report No. 373, Australian Housing and Urban Research Institute (AHURI), Melbourne.
Paddison R (2012) ‘Housing and neighbourhood quality: Urban Regeneration’, International Encyclopedia of Housing and Home: 288-293.
Pevalin DJ, Reeves A, Baker E, Bentley R (2017) ‘The impact of persistent poor housing conditions on mental health: A longitudinal population-based study’, Preventive Medicine 105:304-310.
Phibbs P and Thompson S (2011) ‘The health impacts of housing: toward a policy-relevant research agenda’, AHURI Final Report No. 173, AHURI, Melbourne.
Singh A, Daniel L, Baker E, Bentley R (2019) ‘Housing Disadvantage and Poor Mental Health: A Systematic Review’, Am J Prev Med, 57(2):262-272.
Wimalasena NN., Chang-Richards A, Wang KIK and Dirks KN (2021). ‘Housing risk factors associated with respiratory disease: a systematic review’, International journal of environmental research and public health, 18(6):2815.