Sex and service status group
Suicide rates by sex and service status group
Overview
This section presents suicide rates, age-adjusted suicide rates and numbers of deaths by suicide between 1997 and 2021 broken down by the service status groups (permanent, reserve, and ex-serving). While the absolute number of deaths by suicide has increased since the previous report (due to the expansion of the monitoring period) the suicide rates remain similar, indicating that the overall patterns in suicide risk remain the same.
How do suicide rates vary by service status and sex?
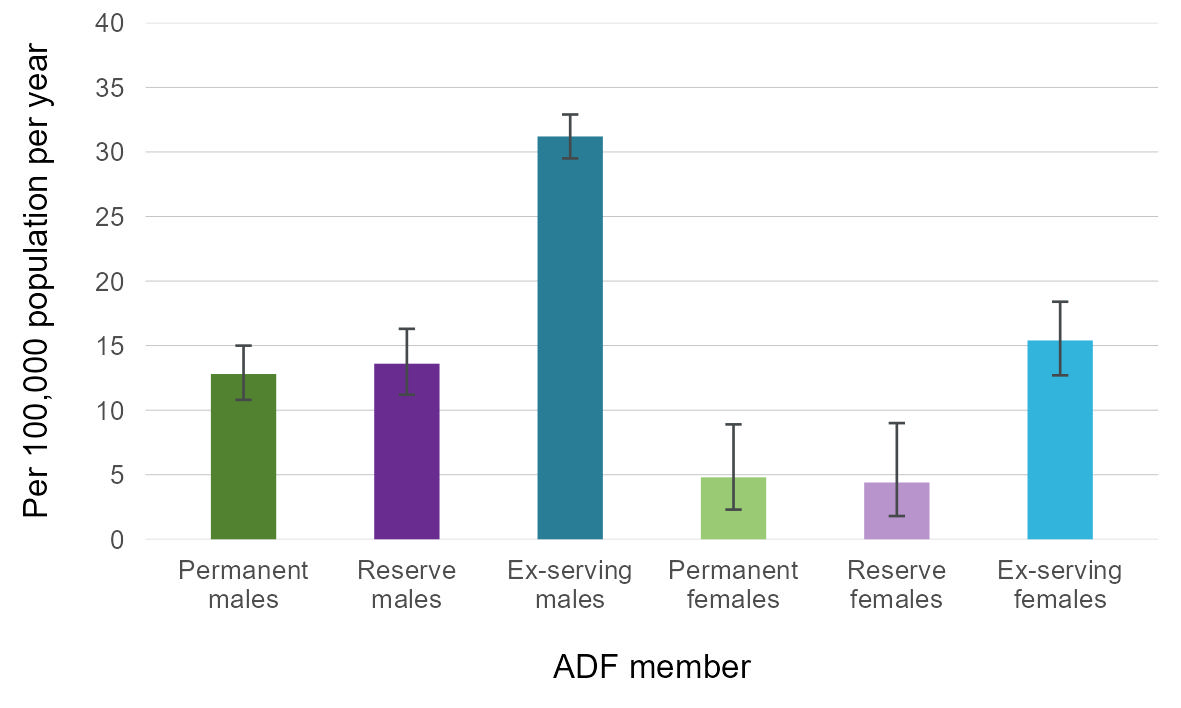
For those with service since 1985, the suicide rate was highest for ex-serving males. Suicide rates between 1997 and 2021 by service status and sex were as follows:
- 12.8 per 100,000 population per year for permanent males
- 13.6 per 100,000 population per year for reserve males
- 31.2 per 100,000 population per year for ex-serving males
- 4.8* per 100,000 population per year for permanent females
- 4.4* per 100,000 population per year for reserve females
- 15.4 per 100,000 population per year for ex-serving females.
Note: * Suicide rates in this Table denoted with a '*' should be interpreted with caution as the number of suicides is fewer than 20. These rates are considered potentially volatile.
These rates are given in Figure 1 below. It is important to note that none of these groups are homogeneous and there are other underlying factors contributing to these results than just service status and sex. The remainder of this report is dedicated to determining differences between subgroups of serving and ex-serving ADF members.
Figure 1: Suicide rate by service status group and sex, 1997–2021
Note: Due to the difference in age profiles with the Australian population a direct comparison in suicide rates with the ADF population is not appropriate here. A comparison with the general Australian population using SMRs is given in the next section How do suicide rates for permanent, reserve, and ex-serving ADF members compare to the general population?
Source: AIHW analysis of linked Defence historical personnel data–PMKeyS–NDI data 1985–2021.
How many ADF members died by suicide over the study period within each service status group?
Between 1997 and 2021 there were 1,677 certified deaths by suicide among members with ADF service since 1 January 1985. Of these, 1,395 occurred among ex-serving members, 162 among permanent members, and 120 among reserves. This is presented in Table 1.
| Males | Females | Persons |
|---|---|---|---|
Serving | 152 | 10 | 162 |
Reserve | 113 | 7 | 120 |
Ex-serving | 1,277 | 118 | 1,395 |
All ADF Members | 1,542 | 135 | 1,677 |
Australian Population(a) | 50,445 | 15,230 | 65,675 |
Notes:
a. Number of deaths by suicide from all ADF members are included in the Australian population deaths by suicide count.
Source: AIHW analysis of linked Defence historical personnel data–PMKeyS–NDI data 1985–2021.
AIHW suicide and self-harm monitoring report data 1997–2021.
The number of deaths by suicide for permanent and reserve members combined and ex-serving members by year, is presented in Table 2. For the number of deaths by suicide for males and females by year see Supplementary table S2.3.
When interpreting Table 2, it is important to remember that the ex-serving population increases each year as described in Box 2 (found here). As such, the increase in ex-serving suicides across the years 1997 to 2021 is not indicative of any increase in suicide rate. See Figure 2 for suicide rates of ex-serving males and females over time. (For population sizes by year see Supplementary tables S10.2 to S10.4, see Data for a link to the tables.)
Year | Permanent and Reserve | Ex-serving | Total in all ADF service groups(a) |
|---|---|---|---|
1997 | 11 | 41 | 52 |
1998 | 13 | 55 | 68 |
1999 | 7 | 50 | 57 |
2000 | 16 | 48 | 64 |
2001 | 18 | 47 | 65 |
2002 | 14 | 37 | 51 |
2003 | 8 | 51 | 59 |
2004 | 12 | 44 | 56 |
2005 | n.p. | n.p. | 51 |
2006(b) | n.p. | n.p. | 42 |
2007(c) | 11 | 49 | 60 |
2008 | 8 | 50 | 58 |
2009 | 13 | 46 | 59 |
2010 | 13 | 63 | 76 |
2011 | 10 | 60 | 70 |
2012 | 7 | 55 | 62 |
2013 | 12 | 56 | 68 |
2014 | 12 | 66 | 78 |
2015 | 10 | 72 | 82 |
2016 | 15 | 74 | 89 |
2017 | 16 | 70 | 86 |
2018 | 6 | 71 | 77 |
2019 | 14 | 76 | 90 |
2020 | 12 | 76 | 88 |
2021 | 13 | 56 | 69 |
Total | 282 | 1,395 | 1,677 |
Notes:
n.p. Not available for publication but included in totals where applicable, unless otherwise indicated. In this case this is a result of low numbers being potentially identifying.
a. Consists of deaths by suicide in males and females for permanent, reserve, and ex-serving ADF members.
b. From 2006 onwards, the ABS implemented a revisions process for coroner-certified deaths (such as suicides). This improved data quality by enabling additional deaths by suicide to be identified beyond initial processing (ABS 2018). For detailed information, see Technical notes.
c. New ABS coding guidelines were applied for deaths registered from 1 January 2007. The new guidelines improve data quality by enabling deaths to be coded as suicide by ABS mortality coders if evidence indicates the death was from intentional self-harm (ABS 2018). For detailed information, see the Technical notes.
Source: AIHW analysis of linked Defence historical personnel data–PMKeyS–NDI data 1985–2021.
How do suicide rates for permanent, reserve and ex-serving ADF members compare to the general population?
After adjusting for age (using Standardised Mortality Ratios (SMRs) to control for differences in age distributions) permanent and reserve males had a lower rate of suicide than the general Australian population. However, ex-serving males and females had a higher rate of suicide than the general Australian male and female population respectively.
Compared with the Australian male or female population (whichever is appropriate), age-adjusted suicide rates between 1997 and 2021 were:
- 49% lower for permanent males
- 45% lower for reserve males
- 26% higher for ex-serving males
- 107% higher (or 2.07 times) for ex-serving females.
The differences between the Australian female population and both permanent and reserve females were not statistically significant, and so the results do not appear here (the differences listed above are statistically significant). While the 107% figure for ex-serving females is larger than the 26% figure for ex-serving males, it should be noted that these are both a comparison with the general Australian population adjusting for age and sex. The overall suicide rate for ex-serving females is significantly lower than it is for ex-serving males (as shown in Figure 1).
It is important to note that these groups are not homogeneous. There are other underlying factors contributing to these numbers which are explored throughout this report.
Unlike suicide rates, these SMRs cannot be used to compare suicide rates between service groups or across time. This is because each SMR is a measure that provides a comparison that is specific to the two populations involved, see the Technical notes for further detail.
How have suicide rates changed over time for the different service status groups?
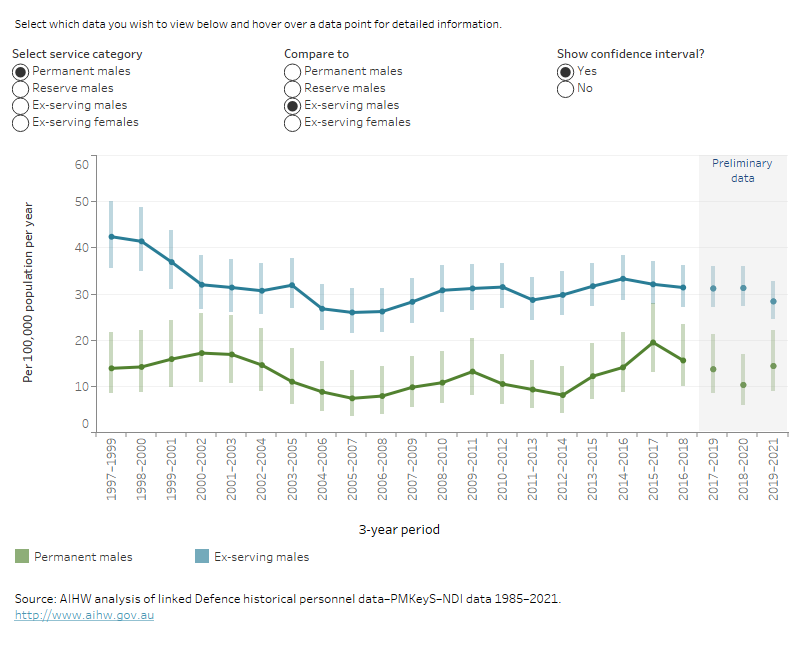
This section presents suicide rates over time in 3-year periods. Due to small numbers, there is some variability in these rates. Over the study period:
- The suicide rate for permanent males remained relatively constant from 1997–1999, with a rate of 13.9 deaths per 100,000 population per year in 1997–1999 and 14.4 in 2019–2021.
- The suicide rate for males in the reserves remained relatively constant from 2003–2005, with no statistically significant differences, ranging between 8.4 deaths per 100,000 population per year in 2003–2005 and 16.5 in 2019–2021.
- The suicide rate for ex-serving males has remained relatively constant since the mid-2000s, with a rate of 26.0 per 100,000 population in 2005–2007 and 28.4 in 2019–2021. There was an overall drop in the rate of suicide from the late 1990s to the mid-2000s, which is consistent with the pattern observed in Australian males over the same period.
- The suicide rate for ex-serving females has fluctuated between 7.6 deaths per 100,000 population per year in 2003–2005 and 23.4 in 2015–2017. There is no easily identifiable trend due to the wide confidence intervals around these rates from the low total numbers.
The interactive graph below (Figure 2) presents the suicide rates for males in each of the 3 ADF service status groups and ex-serving females, for all 3-year periods from 1997–1999 to 2019–2021. The rates of suicide for males and females for the Australian general population are presented in Figures 3 for comparison.
Figure 2: Rate of suicide by service status and sex, 1997–1999 to 2019–2021
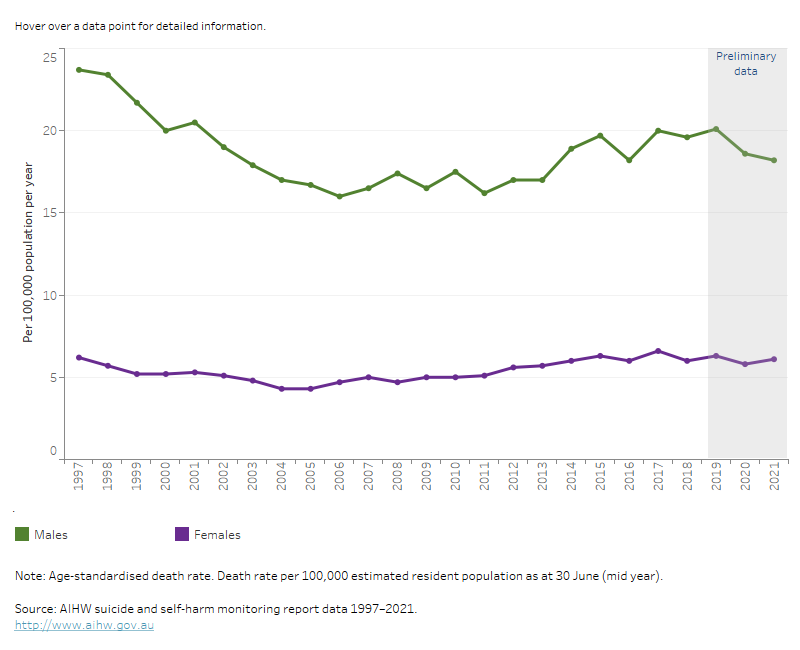
This time series line graph shows the weighted average suicide rate per 100,000 population per year by service status and sex over time by 3-year periods from 1997 to 1999, to 2019 to 2021.
This time series line graph shows the weighted average suicide rate per 100,000 population per year by service status and sex over time by year from 1997 to 2021.