Reason for separation
The reasons that members separate from the ADF can be categorised into 4 broad groups (see Technical notes for the categorisation of these groups):
- Voluntary separation
- Involuntary separation for reasons other than medical (referred to as other involuntary separation)
- Involuntary medical separation
- Contractual or administrative change.
The separation date used in this report is when a member leaves the ADF entirely, that is when they are no longer a permanent or reserve member. Separation reason is therefore the reason recorded for leaving their last engagement with the ADF.
Due to a change in the way the reason for separating from the ADF was recorded in 2002, analysis is only reported for ADF members who separated from 1 January 2003 onwards and does not include those who separated prior to 2003. ADF members who separated from 1 January 2003 comprise 43% of the ex-serving cohort who had served at least 1 day since 1 January 1985. Among this cohort:
- the most common type of reason for separation was voluntary separation, with similar proportions for males and females (45% and 44% respectively)
- this was followed by other involuntary separation (males 29% and females 23%)
- next was involuntary medical separation (males 15% and females 19%)
- for contractual or administrative changes these accounted for 11% of male separations, and 14% of female separations.
Between 2003 and 2021, the suicide rate for ex-serving males by reason for separation was lowest for those who separated either voluntarily or for contractual/administrative reasons (21.5 and 17.5 per 100,000 population per year respectively) and highest for those whose reason for separation was involuntary medical (67.1 per 100,000 population per year).
This is demonstrated in Table 7 and Figure 9 below.
Reason for separation | Ex-serving males: Suicide rate per 100,000 population per year | Ex-serving females: Suicide rate per 100,000 population per year |
|---|---|---|
Voluntary | 21.5 | 17.7* |
Other involuntary | 35.7 | 17.5* |
Involuntary medical | 67.1 | 37.7* |
Contractual or administrative | 17.5* | 0 |
Note:
a. Due to a change in the way the reasons for separating the ADF was recorded during 2002, analysis is presented only for ADF members who left from 1 January 2003 onwards. These members comprise 43% of the total ex-serving members with at least 1 day of service since 1 January 1985.
* Suicide rates in this Table denoted with a '*' should be interpreted with caution as the number of suicides is fewer than 20. These rates are considered potentially volatile.
Source: AIHW analysis of linked Defence historical personnel data–PMKeyS–NDI data 1985–2021.
Figure 9: Suicide rates by reason for separation, ex-serving males, 2003–2021
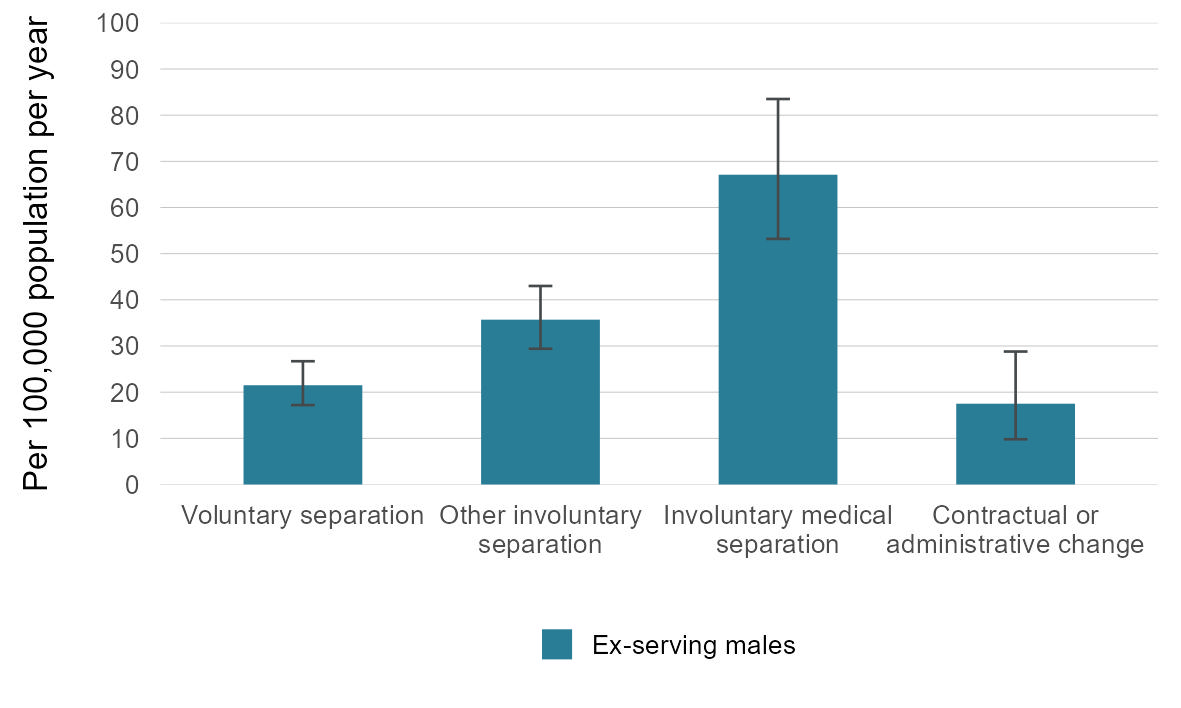
Source: AIHW analysis of linked Defence historical personnel data–PMKeyS–NDI data 1985–2021.
The age-adjusted analysis for the male voluntary and contractual/administrative separation cohorts indicates that there is no statistical difference in suicide rate between these cohorts and the Australian male population. Similar analyses indicate that the involuntary separation cohorts have a higher rate of suicide than the Australian population.
Compared with the Australian male population, suicide rates between 2003 and 2021 for ex-serving males were:
- similar to those who separated for voluntary reasons with no statistically significant difference found
- 54% higher for those who separated for other involuntary reasons
- 178% higher (or 2.78 times) for those who separated for involuntary medical reasons
- similar to those who separated for contractual or administrative reasons, with no statistically significant difference found.
Of the sub-populations studied in this report, the male involuntary medical separation cohort has the highest suicide rate. Last year’s modelling analysis chapter showed that the involuntary medical separation group was the most at-risk sub population for death by suicide among ex-serving population, even when accounting for other variables such as age, sex and service-related characteristics (AIHW 2022).
A challenge that would require further investigation is assessing the feasibility of comparing rates of suicide between the involuntary medical separation cohort and other appropriate populations, such as people with similar medical conditions.
Between 2003 and 2021, the suicide rates for ex-serving females by reason for separation were statistically similar for voluntary separation, involuntary medical separation, and other involuntary separation, noting that the wide confidence intervals here make significant differences difficult to identify. Where comparisons are found to be not statistically significant, there may still be a real difference of practical importance that the statistical test did not detect due to the small size of the female veteran cohort. See Supplementary table S4.2.
Since there were no suicide deaths among ex-serving females who separated for contractual or administrative reasons this column does not appear in Figure 10 below.
Figure 10: Suicide rates by reason for separation, ex-serving females, 2003–2021
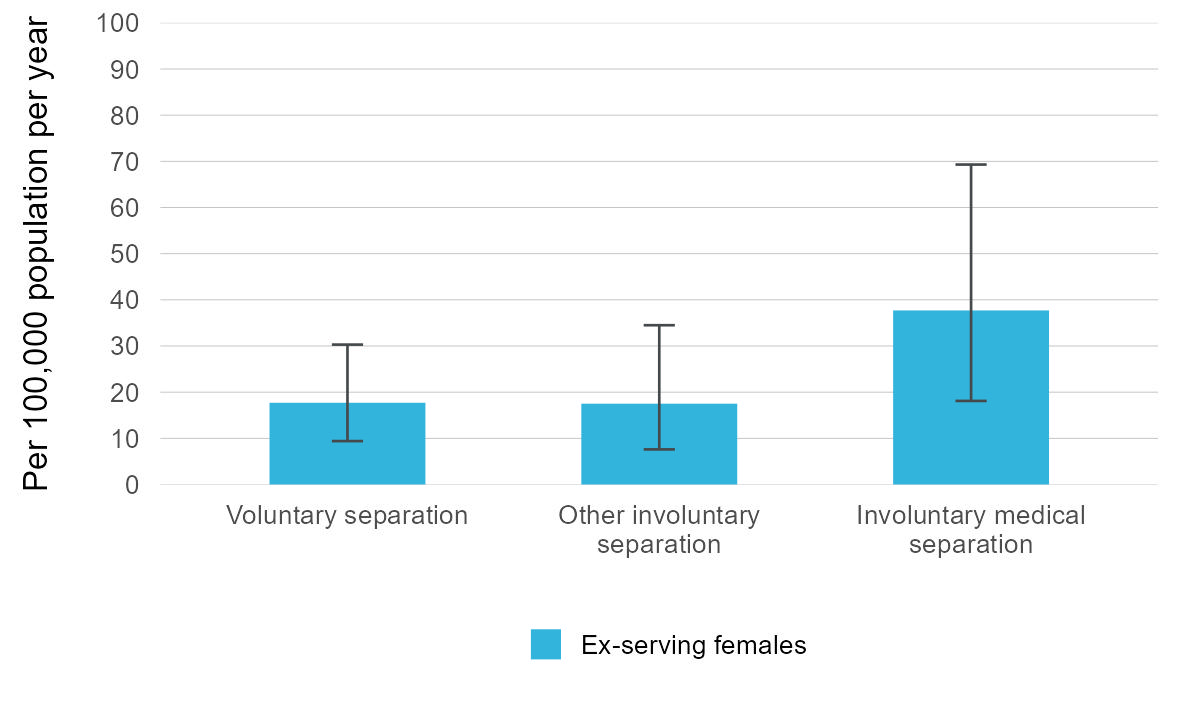
Source: AIHW analysis of linked Defence historical personnel data–PMKeyS–NDI data 1985–2021.
Due to the shortened period of usable data and overall low numbers the time series graphs for reason for separation are not presented. Age and sex standardised analyses for ex-serving females broken down by reason for separation show that each reason for separation cohort (apart from contractual or administrative) has a higher suicide rate compared to the respective general Australian population, including the voluntary separation cohort.
Data underlying these graphs are available in Supplementary table S4.1 and S4.2. See Data for a link to the tables.
Please note, data for more recent years are subject to change; see the Technical notes for further detail.
Help or support
If you need help or support, please contact:
- Open Arms – Veterans and Families Counselling – Phone: 1800 011 046
- Open Arms Suicide Intervention
- Defence All-hours Support Line (ASL) – Phone: 1800 628 036
- Defence Member and Family Helpline – Phone: 1800 624 608
- Defence Chaplaincy Support
- ADF Mental Health Services
- Lifeline – Phone: 13 11 14
- Suicide Call Back Service – Phone: 1300 659 467
- Beyond Blue Support Service – Phone: 1300 22 4636
For information on support provided by DVA, see: