Length of service
Suicide rates by length of service
Length of service describes the time between joining the ADF and separation1. For suicide rates analysis in this report, length of service is presented in 5 groups (ranging from less than 1 year to more than 20 years).
The proportions of ex-serving males and females by varying length of service were as follows:
- 13% of males and 17% of females had served less than 1 year.
- 26% of males and 32% of females had between 1–<5 years of service.
- 18% of males and 21% of females had between 5–<10 years of service.
- 20% of males and 20% of females had between 10–<20 years of service.
- 23% of males and 10% of females had served 20 or more years.
The average length of service was higher for males than females (11 years and 8.0 years respectively).
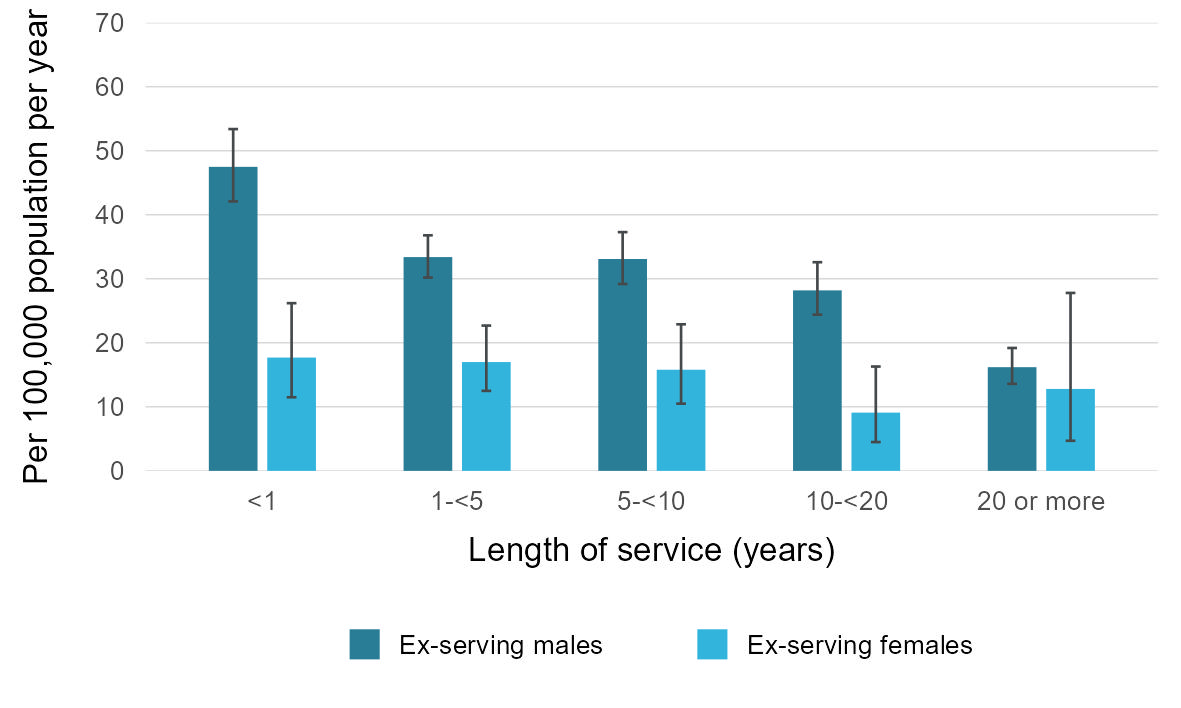
Suicide rates for ex-serving males decreased as length of service increased. The suicide rate was lowest for males who served more than 20 years (16.2 per 100,000 population per year) and highest for those who had served less than one year (47.5 per 100,000 population per year). These are significantly different from the 1–<5, 5–<10 and 10–<20 year categories, which are themselves statistically similar, as shown in Figure 11 below.
For ex-serving females, rates of suicide were statistically similar for all lengths of service. This is shown in Table 8 and Figure 11 below.
Length of service (years)(a) | Ex-serving males: Suicide rate per 100,000 population per year | Ex-serving females: Suicide rate per 100,000 population per year |
|---|---|---|
<1 | 47.5 | 17.7 |
1–<5 | 33.4 | 17.0 |
5–<10 | 33.1 | 15.8 |
10–<20 | 28.2 | 9.1* |
20 or more | 16.2 | 12.8* |
Notes:
* Suicide rates in this Table denoted with a '*' should be interpreted with caution as the number of suicides is fewer than 20. These rates are considered potentially volatile.
a. The time between the date of hire and date of separation from the ADF.
Source: AIHW analysis of linked Defence historical personnel data–PMKeyS–NDI data 1985–2021.
Figure 11: Suicide rate by length of service, ex-serving males and females, 1997–2021
Source: AIHW analysis of linked Defence historical personnel data–PMKeyS–NDI data 1985–2021.
Suicide rates by length of service over time
The suicide rates for ex-serving males by the 5 length of service groups were relatively stable over time. There appears to be a large decrease over the years 2004 to 2007 among the <1 year cohort, though this fluctuation is not statistically significant relative to other datapoints in this series.
Due to the small number of suicide deaths among ex-serving females, suicide rates by length of service over time are not reported.
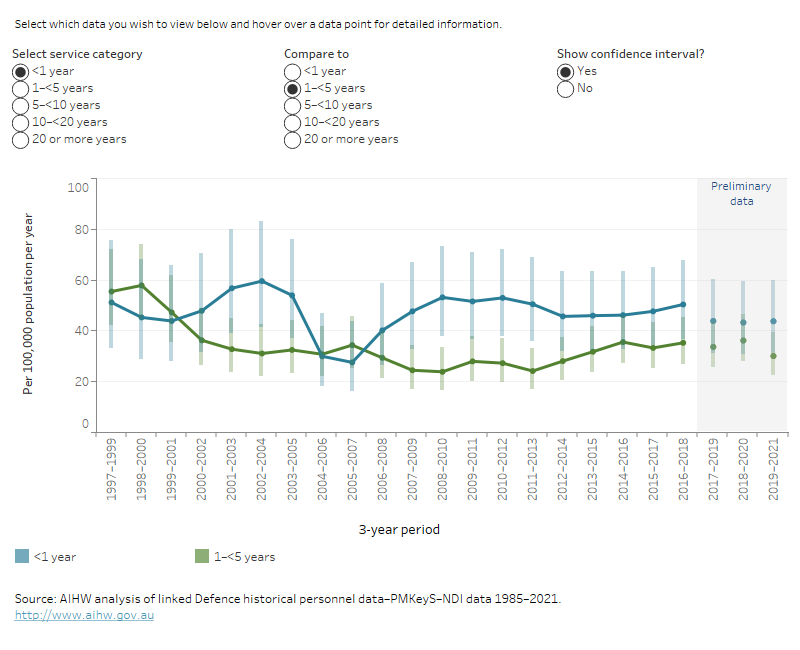
The interactive graph below (Figure 12) presents the suicide rates for ex-serving males in each of the length of service groups, for all 3-year periods from 1997–1999 to 2019–2021.
Figure 12: Rate of suicide for ex-serving males by length of service, 1997–1999 to 2019–2021
This time series line graph shows the weighted average suicide rate per 100,000 population per year of ex-serving males by length of service over time by 3-year periods from 1997 to 1999, to 2019 to 2021.