Time since separation
Suicide rates by time since separation
For ex-serving members who died during the monitoring period, time since separation is the time between full separation from the ADF and date of death. For members who were alive at the end of the monitoring period, the time since separation is the time between their separation from the ADF and 31 December 2021. In this report, time since separation is presented in 5 groups (ranging from less than one year to more than 20 years).
The proportions of the ex-serving cohort, alive and deceased, that fall into each time since separation category are:
- Around half (52% of males and 53% of females) separated from the ADF 20 or more years ago, or 20 or more years before their death.
- Just under one quarter (22% of males and 22% of females) separated from the ADF between 10 and 20 years ago, or between 10 and 20 years before their death.
- For males 14%, and for females 12% separated from the ADF between 5 and 10 years ago, or between 5 and 10 years before their death.
- For males 9.1%, and for females 10% separated from the ADF between 1 and 5 years ago, or between 1 and 5 years ago before their death.
- Around 2.5% of males and 2.7% of females separated less than 1 year ago, or less than 1 year before their death.
Table 9 below gives the suicide rates corresponding to these categories.
Time since separation (years)(a) | Ex-serving males: Suicide rate per 100,000 population per year | Ex-serving females: Suicide rate per 100,000 population per year |
|---|---|---|
<1 | 30.1 | 25.7* |
1–<5 | 32.5 | 12.4* |
5–<10 | 31.6 | 17.4 |
10–<20 | 31.9 | 15.5 |
20 or more(b) | 29.3 | 14.0 |
Notes:
a. The period between separation date and extract date (31 December 2021) for those alive at the extract date. The period between separation date and death for ex-serving members who have died.
b. Due to the study population, suicide rates for time since separation 20 or more are from 2005–2021.
* Suicide rates in this Table denoted with a '*' should be interpreted with caution as the number of suicides is fewer than 20. These rates are considered potentially volatile.
Source: AIHW analysis of linked Defence historical personnel data–PMKeyS–NDI data 1985–2021.
The average time since separation for all ex-serving members was 20 years and the maximum length of time since separation observed in this study was 37 years.
The rates of suicide were similar regardless of time since separation for both ex-serving males and females, as demonstrated below in Figure 13.
Figure 13: Suicide rate by time since separation, ex-serving males and females, 1997–2021
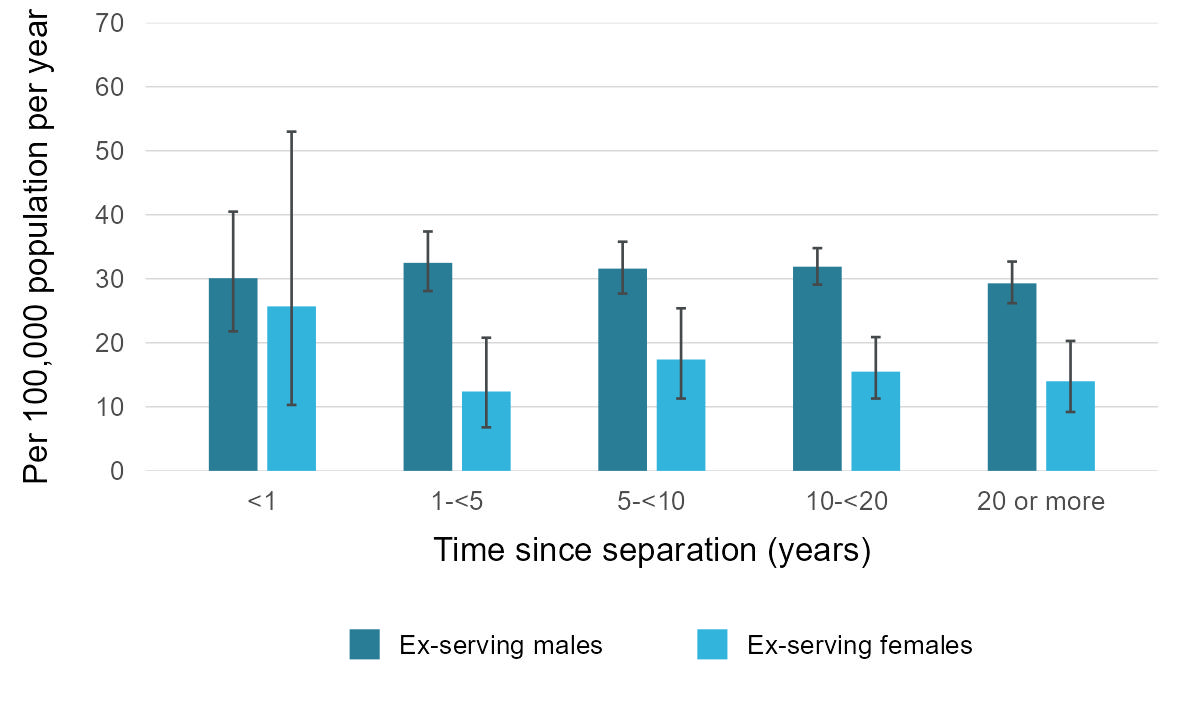
Source: AIHW analysis of linked Defence historical personnel data–PMKeyS–NDI data 1985–2021.
Suicide rates for time since separation over time
Suicide rates over time for ex-serving males by time since separation are presented in the interactive graph below. Note that due to small numbers of suicide deaths with less than one year since separation data are aggregated and presented for less than 5 years since separation.
Due to the small number of suicide deaths among ex-serving females, suicide rates over time are not reported.
Although there has been some small variation in the suicide rates for individual groups over time, these variations were not significant.
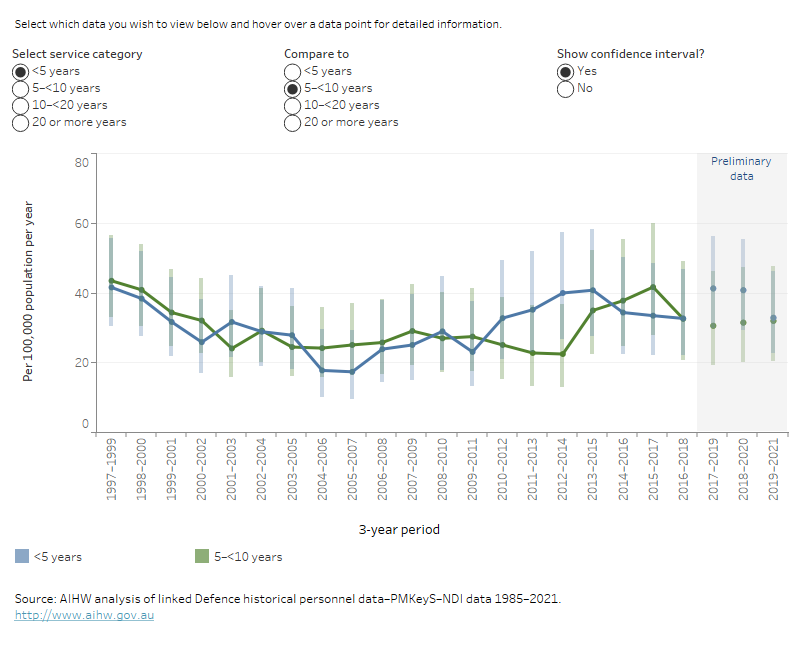
The interactive graph below (Figure 14) presents the suicide rates for ex-serving males in each of the time since separation groups for all 3-year periods from 1997–1999 to 2019–2021.
Figure 14: Rate of suicide for ex-serving males by time since separation, 1997–1999 to 2019–2021
This time series line graph shows the weighted average suicide rate per 100,000 population per year of ex-serving males by time since separation over time by 3-year periods from 1997 to 1999, to 2019 to 2021.