Older people
Key findings
View the Older people fact sheet >
Older people make up a considerable proportion of Australia’s population. In 2021, over 1 in 6 people were aged 65 and over and the number and proportion of older Australians is expected to continue to grow (ABS 2022b, AIHW 2023c). Older people have unique health circumstances including pain, co-morbidities, and social circumstances such as isolation (DoH 2017). These factors are important to consider in the context of alcohol and other drug use. Refer to Box OLDER1 for how ‘older people’ are defined in this report.
Box OLDER1: How do we define ‘old’?
Most population data define ‘old’ as persons aged 65 and over to align with the qualifying age for the Age pension. However, this section will generally refer to people aged 50 and over in order to capture people who may be ageing prematurely due to alcohol and other drug use. (AIHW 2016). The different older age cohorts are specified where relevant.
Tobacco smoking
The Australian burden of disease study 2018 found that tobacco use was one of the leading risk factors contributing to the burden of disease for older Australians. Specifically, tobacco use was the leading risk factor for males aged 65–84 and females aged 45–84 (AIHW 2021).
Data from the 2022–2023 National Drug Strategy Household Survey (NDSHS) showed that the proportion of people in their 50s and 60s who smoke daily is not declining at the same rate as that for younger age groups, while for people over 70 it has increased slightly (AIHW 2024b).
Daily smoking
The 2022–2023 NDSHS reported an ageing cohort of daily smokers and a tendency for younger people to not take up smoking. Among people who smoke daily:
- In 2001 the proportion of people who smoked daily was highest among people aged 30-39 (25% in 2001, decreasing to 18.7% in 2022–2023).
- In 2022–2023 the proportion of people who smoked daily was highest among people aged 50-59 (14.2% in 2001, increasing to 21% in 2022–2023).
- Between 2019 and 2022–2023, the proportion of daily smokers who were aged in their 50s remained stable at 21%, while for those in their 60s it increased from 12.7% to 16.2% (AIHW 2024b, Table 2.6).
Number of cigarettes
Data from the NDSHS showed that people in older age groups (50 and over) tend to smoke more cigarettes than people in younger age groups. In 2022–2023:
- People in their 50s (16.5 cigarettes), 60s (17 cigarettes), and aged 70 and over (14.6 cigarettes) smoked the highest number of cigarettes per day on average. This was around double the number of cigarettes smoked by people aged 18–24 (7 cigarettes) (AIHW 2024b, Table 2.8).
- Smokers in their 50s (46%), 60s (45%), and aged 70 and over (35%) were the most likely to smoke 20 or more cigarettes per day (pack-a-day smokers).
- The proportion of daily smokers aged 14 and over who are pack-a-day smokers increased from 2019 (33%) to 2022–2023 (35%) (AIHW 2024b, Table 2.7).
Intentions to quit
Estimates from the NDSHS also showed that people in older age groups are the least likely to have intentions to quit smoking (AIHW 2024b). In 2022–2023:
- The proportion of current smokers who were not planning on quitting smoking was higher among people in their 50s (38%), 60s (41%), and aged 70 and over (57%) compared with all current smokers (33%) (AIHW 2024b, Table 2.40).
- The main reason that people in older age groups did not intend to quit was because they enjoy smoking (ranging from 59% for people in their 50s to 70% for those aged 70 and over). This was consistent with other age groups (AIHW 2024b, Table 2.42).
Alcohol consumption
New Australian guidelines to reduce health risks from drinking alcohol were released in December 2020.
Data from the 2022–2023 NDSHS indicated that a higher proportion of people in older age groups have given up alcohol, compared with younger people. In 2022–2023, people in their 50s (8.7%), 60s (10.5%), and those aged 70 and over (15.5%) were more likely to be ex-drinkers than were people aged 14 and over (8.2%) (AIHW 2024b, Table 4.4).
However, people in older age groups who do consume alcohol are more likely to drink daily (AIHW 2024b).
Daily drinking
Estimates from the NDSHS show that the proportion of people who drink daily increases with age. In 2022–2023:
- People aged 70 and over continued to be the most likely to drink daily (11.7%), followed by people in their 60s (8.5%) and 50s (6.5%).
- A higher proportion of males than females were daily drinkers for people in their 50s (8.3% compared with 4.7%), 60s (11.2% and 6%), and aged 70 and over (15.3% and 8.5%) (AIHW 2024b, Table 4.4).
Risky drinking
The proportion of people in older age groups who exceed the guidelines for alcohol varies according to age (AIHW 2024b). Estimates from the NDSHS show that, in 2022–2023:
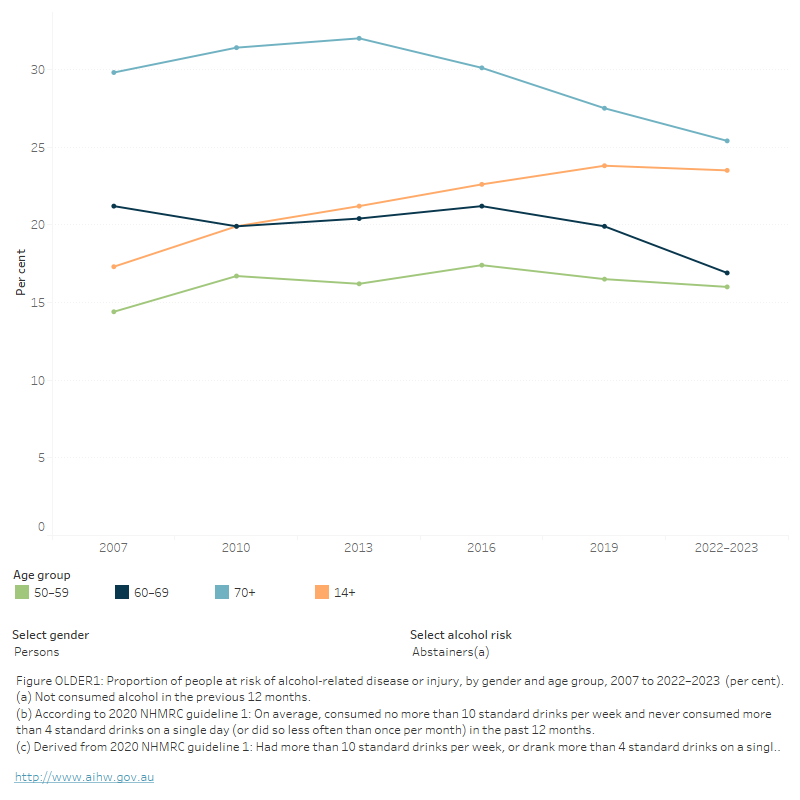
- People in their 50s (32.3%) and 60s (33.2%) were more likely to drink at levels that exceeded the risk guidelines than the general population aged 14 and over (30.7%), while people aged 70 and over (24.9%) were less likely to do so.
- Females (28%) in their 50s and males (44%) in their 60s were more likely to drink at levels that exceeded the guidelines than the general population (23% of females and 39% of males aged 14 and over) (Figure OLDER1; AIHW 2024b, Table 4.28).
FIGURE OLDER1: Proportion of people at risk of alcohol-related disease or injury, by gender and age group, 2007 to 2022–2023 (per cent)
The figure shows that the proportion of people who recently exceeded lifetime risk for alcohol has remained relatively stable for older people (aged 50–59, 60–69 and 70 and over) since 2007.
People in older age groups (50 and over) are less likely to consume 11 or more standard drinks in a single day at least once in the past 12 months than the general population (AIHW 2024b). Estimates from the NDSHS show that, in 2022–2023:
- People in their 60s (6.2%) and aged 70 and over (3.5%) were the least likely to have consumed 11 or more standard drinks in a single day at least once a year (AIHW 2024b, Table 4.32).
- The proportion of people in older age groups (50 and over) who consumed alcohol at these levels at least yearly and at least monthly has remained stable from 2019 to 2022–2023 (AIHW 2024b, Table 4.32).
Illicit drugs
Data from the 2022–2023 NDSHS showed that a greater proportion of older Australians reported illicit drug use than in previous years, indicating that there is an ageing cohort of people who use illicit drugs (AIHW 2024b).
- The proportion of people aged 60 or older who had used illicit drugs in their lifetime increased significantly between 2019 (29%) to 2022–2023 (34%). There were significant increases for both males (from 34% to 39%) and females (24% to 30%) (AIHW 2024b, Table 5.4).
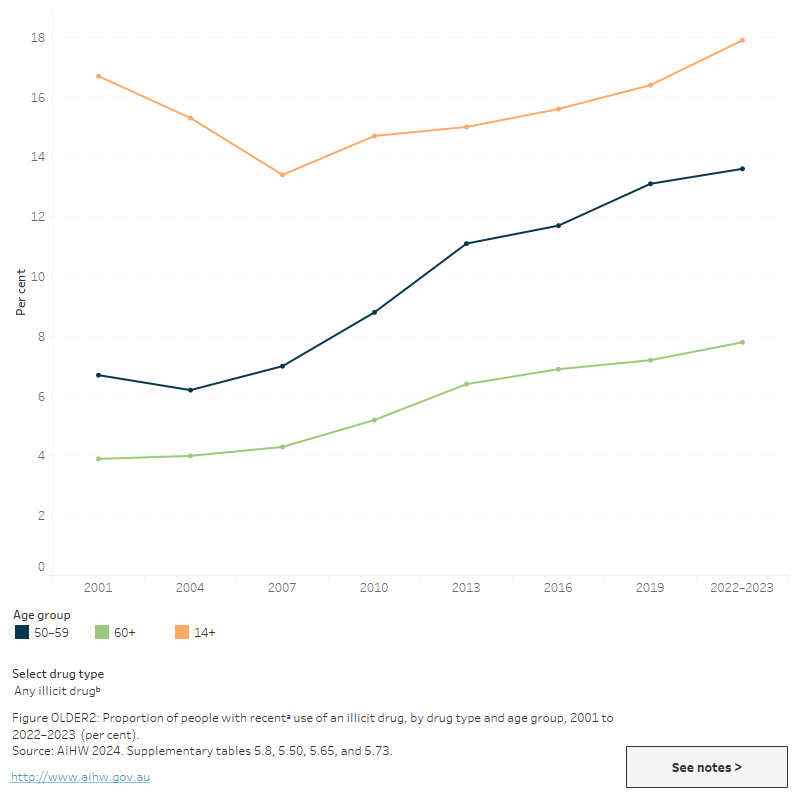
- Between 2001 and 2022–2023, recent use of any illicit drug has nearly doubled among people in their 50s (from 6.7% to 13.6%), with similar increases among both males (from 8.1% to 16.1%) and females (5.2% and 11%) (AIHW 2024b, Table 5.8).
- Recent illicit drug use has also increased among those aged 60 and over, from 3.9% in 2001 to 7.8% in 2022–2023 (AIHW 2024b, Table 5.8).
- The age distribution of people who have recently used illicit drugs has shifted over time, reflecting an ageing cohort of people who use drugs. In 2001, 6.1% of people who had recently used an illicit drug were in their 50s and 4.4% were aged 60 and over. In 2022–2023, this increased to 11.3% and 11.6%, respectively (AIHW 2024b, Table 5.12).
- The difference in the proportion of recent illicit drug use between people in older age groups (50 and over) and the general population (14 and over) continues to decrease (Figure OLDER2).
- The most commonly used illicit drug by older people is cannabis.
FIGURE OLDER2: People with recenta use of an illicit drug, by drug type and age group, 2001 to 2022–2023 (per cent)
The figure shows that, between 2001 and 2019, recent illicit drug use has increased among people aged 50–59 (6.7% in 2001 and 13.1% in 2019) and 60+ (3.9% in 2001 and 7.2% in 2019).
View data tables >
Cannabis
People in older age groups continue to be less likely to use cannabis than the general population aged 14 and over (AIHW 2024b). However, the proportion of older people who have recently used cannabis has increased over time. Specifically, the 2022–2023 NDSHS showed that:
- Recent use of cannabis has been increasing since 2001 among people in their 50s and those aged 60 and over (Figure OLDER2).
- Between 2019 and 2022–2023, recent use of cannabis increased among those aged 60 and over (2.9% to 3.6%) (AIHW 2024b, Table 5.50).
Data from the NDSHS suggest that older people are also more likely to use cannabis for medical purposes than people in younger age groups. In 2022–2023, 39% of people who had recently used cannabis for medical purposes only were aged 50 and over, while 18% of people who used cannabis for other reasons were aged 50 and over (AIHW 2024b, Table 8.5).
Pharmaceuticals
Prescription drug dispensing
Data from the Pharmaceutical Benefits Scheme (PBS) provide information on the number of prescriptions dispensed and the number of patients dispensed supplied at least one script under the PBS within a given financial year. The PBS database includes information medicines that may be used for non-medical purposes, including opioids, benzodiazepines and gabapentinoids. These numbers largely represent medicines being prescribed for and used for their intended purposes, but monitoring dispensing of these drugs is important in the context of harm reduction (see Box PHARMS1). Refer to the Technical notes and Box PHARMS2 for more information.
Data from the PBS indicate that rates of dispensing of opioids, benzodiazepines and gabapentinoids (such as pregabalin) increase with increasing age and are highest for people aged over 60 (Figure PHARMS2; tables PBS6, PBS8, PBS26, PBS28, PBS50 and PBS52). In 2021–22:
- People aged 80 and over had the highest rates of scripts dispensed and patients of any age group for opioids, benzodiazepines and gabapentinoids. This was followed by people aged 70–79, 60–69 and 50–59.
- Among people aged 80 and over, the rate of scripts dispensed for:
- Opioids (around 233,000 scripts per 100,000) was between 2.0 and 177 times higher than for people in younger age groups (ranging from 1,300 scripts per 100,000 for people aged less than 18 to 119,000 for those aged 70–79).
- Benzodiazepines (74,800 scripts per 100,000) was between 1.8 and 190 times higher than for people in other age groups (ranging from 390 scripts per 100,000 for people aged less than 18 to 42,000 for those aged 70–79).
- Gabapentinoids (69,600 scripts per 100,000) was between 1.4 and 400 times higher than for people in other age groups (ranging from 170 scripts per 100,000 for people aged less than 18 to 49,000 for those aged 70–79).
- Females aged 80 and over had the highest dispensing rates of any group for opioids (around 282,000 scripts and 31,900 patients per 100,000 population), benzodiazepines (90,000 scripts and 18,000 patients per 100,000) and gabapentinoids (77,900 scripts and 9,700 patients per 100,000) (Figure PHARMS2; tables PBS6, PBS8, PBS26, PBS28, PBS50 and PBS52).
People in older age groups consistently had the highest rates of dispensing for opioids, benzodiazepines and gabapentinoids between 2012–13 and 2021–22. However, rates of dispensing of benzodiazepines and opioids declined over time for these age groups. Conversely, gabapentinoid dispensing rates increased across the period, but have stabilised since 2017–18 (Figure PHARMS2; tables PBS6, PBS8, PBS26, PBS28, PBS50 and PBS52).
Non-medical use of pharmaceuticals
Similar to cannabis, non-medical use of pharmaceutical drugs is generally lower among older age groups than the general population aged 14 and over. However, pharmaceuticals are the second most common drug used by older people.
- In 2022–2023, 4.0% of people in their 50s and 3.7% of those aged 60 and over reported recent use of a pharmaceutical for non-medical purposes, compared with 5.3% of all people aged 14 and over (AIHW 2024b, Table 6.3).
- In 2022–2023, recent non-medical use of pain-killers/pain relievers and opioids among people aged 50 and over was 2.1% compared with 2.2% of all people aged 14 and over (AIHW 2024b, Table 6.9).
- In 2022–2023, recent non-medical use of pharmaceutical stimulants among people aged 50 and over was 0.6% compared with 2.1% of all people aged 14 and over (AIHW 2024b, Table 6.19).
Health and harms
For related content on health and harms, see also:
Drug-related hospitalisations
National Drug and Alcohol Research Centre (NDARC) analysis of the National Hospital Morbidity Database of drug-related hospitalisations (excluding alcohol) showed that, in 2020–21, people aged 20–29 and 30–39 had the highest rates of drug-related hospitalisations of any age group. However, this rate has been increasing among older age groups. From 1999–2000 to 2020–21:
- The rate of drug-related hospitalisations increased for people aged 50–59 (from 94.3 to 172.9 hospitalisations per 100,000 population), 60–69 (from 51.3 to 81.2 per 100,000) and people aged 70 and over (from 52.7 to 68.5 per 100,000).
- Males aged 40–49 had the greatest increase in the rate of hospitalisations of any group, increasing from 165 per 100,000 population in 1999–2000 to 357 per 100,000 population in 2020–2021 (Chrzanowska et al. 2022).
Deaths due to harmful alcohol consumption
Alcohol-induced deaths are defined as those that can be directly attributable to alcohol use, as determined by toxicology and pathology reports (for example, chronic conditions such as alcoholic liver cirrhosis or acute conditions such as alcohol poisoning). Alcohol-related deaths include deaths directly attributable to alcohol use and deaths where alcohol was listed as an associated cause of death (for example, a motor vehicle accident where a person recorded a high blood alcohol concentration) (ABS 2018a).
The 2022 data on causes of death have been updated in this release sourced from the ABS (2023) and AIHW. Additional analysis undertaken by NDARC will be updated in mid 2024.
In 2022, the ABS reported 1,742 alcohol-induced deaths and the majority (84.6%) of these deaths were in people aged 45 years and over (1,474 deaths) (ABS 2023, Table 13.12).
Nine in 10 (91.2%) alcohol-induced deaths were due to the chronic effects of alcohol (1,588 deaths) and these deaths were predominantly in people aged 45 years and over (1,374 deaths, 86.5%) (ABS 2023, Table 13.16). People aged 55–64 had the highest age-specific rate (17.5 deaths per 100,000 population), accounting for 30.4% of all alcohol-induced deaths (530 deaths). Additionally:
- The highest age-specific rates for males were for those aged 55–64 years (25.0 per 100,000 population), followed by those 65 and over (20.2 per 100,000 population).
- The highest age-specific rates for females were also those aged 55–64 years, (10.3 per 100,000 population), followed by those 45–54 years (7.9 per 100,000 population) (ABS 2023, Table 13.12).
- The median age at death was higher for males than females (59.5 and 58.6 years, respectively) (ABS 2023, Table 13.15).
Drug-induced deaths
Drug-induced deaths are defined as those that can be directly attributable to drug use and include both those due to acute toxicity (for example, drug overdose) and chronic use (for example, drug-induced cardiac conditions) as determined by toxicology and pathology reports (ABS 2022a).
In 2022, the ABS reported 1,693 drug-induced deaths. Of these deaths:
- 55.8% were in people aged 45 years and over (944 deaths).
- Overall, the highest rate was in the 45–54 year age group, with an age-specific rate of 13.8 deaths per 100,000 population.
- this age group was also the highest for both males and females (17.1 and 10.7 per 100,000 population, respectively) (ABS 2023, Table 13.2).
- Almost half (46%, or 184 deaths) of intentional drug-induced deaths were for those aged 55 and over (ABS 2023, Table 13.4).
AIHW analysis of the National Mortality database shows that in 2022, people aged 65 years and over were the only age group to not have personal history of self-harm as the most frequently occurring psychosocial risk factor. Personal history of self-harm was the third most frequently occurring risk factor, behind limitation of activities due to disability (17% of drug-induced deaths in this age group) and disappearance and death of a family member (12%) (Table 2.7).
Data analysis on causes of death in Australia by the National Drug and Alcohol Research Centre (NDARC) show that the age profile of drug-induced deaths has changed over the last 2 decades with deaths occurring in older age groups. Specifically:
- Between 2002 and 2005, the highest rate of drug-induced deaths was recorded for people aged 25–34 years. Between 2006 and 2021, people aged 35-44 and 45-54 had the highest rates of death.
- In 2021, people aged 45-54 had the highest rate of drug-induced deaths (14 per 100,000 population).
- The rate for people aged 85+ increased between 2019 (6.3 per 100,000 population) and 2021 (11 per 100,000 population) (Chrzanowska et al. 2023).
Opioid-induced deaths have continued to decrease for people aged 55-64 (7.3 per 100,000 population in 2018 to 5.2 in 2021). Between 2020 and 2021, death rates among people aged:
- 65–74 decreased (2.5 per 100,000 population to 2.2).
- 75–84 increased (1.5 per 100,000 in 2020 to 1.9 in 2021) (Chrzanowska et al. 2023).
Treatment
The latest Alcohol and other drug treatment services in Australia: early insights report shows that in 2022–23, 12.1% of clients receiving treatment for their own drug use were aged 50–59 and 5.9% were aged 60 and over (AIHW 2024a). These proportions are similar to 2021–22 (11.2% and 5.2%, respectively).
Data collected for the AODTS NMDS are released twice each year: an early insights report in April and a detailed report mid-year. The section below will be updated with information from the annual report once these data become available.
The Alcohol and Other Drug Treatment Services National Minimum Data Set (AODTS NMDS) provides information on treatment provided to clients by publicly funded AOD treatment services, including government and non-government organisations. Data from AIHW’s AODTS NMDS and National Opioid Pharmacotherapy Statistics Annual Data (NOPSAD) collections indicate that, in the last 11 years, an ageing cohort of Australians receiving drug and alcohol treatment has emerged.
NOPSAD data indicate that:
- On a snapshot day in 2022, 22% of clients who received opioid pharmacotherapy treatment were aged 50–59.
- The median age of clients who received opioid pharmacotherapy treatment has increased from 38 years in 2011 to 44 in 2022 (AIHW 2023b).
Data from the AODTS NMDS show that 17% of clients who received treatment for their own or someone else’s alcohol or other drug use in 2021–22 were aged 50 and over. This has increased from 13% in 2016–17 (AIHW 2023a, Table SC.3).
In 2021–22, among clients who received treatment for their own AOD use:
- Alcohol was the most common principal drug of concern among clients aged 50–59 (64% of clients), followed by amphetamines (13%).
- Alcohol was also the most common principal drug of concern for those aged 60 and over (77% of clients), followed by cannabis (6%) (AIHW 2023a, Table SC.10).
- Counselling was the most common treatment type for clients aged 50–59 (40% of clients) and those aged 60 and over (35%), followed by assessment only (24% of clients aged 50–59 and 34% of those aged 60 and over) (AIHW 2023a, Table SC.19).
The AODTS data were matched with the Specialist Homelessness Services (SHS) collection to identify clients who use both services (matched clients) and compared characteristics between the groups (AIHW 2016). Older clients were identified as one of 4 vulnerable cohorts in the analysis (along with clients with a current mental health issue, clients who experienced family and domestic violence and young clients aged 15–24). The analysis found that matched clients aged 50 and over (when compared to the other vulnerable cohorts) were more likely to be:
- male (68%) and living alone (69%)
- receiving treatment for alcohol (68%)
- Indigenous (17%).
Older clients had similar patterns of alcohol and other drug treatment types, regardless of whether they were in the matched group or AODT-only group, with counselling being the most commonly provided treatment type for all older clients (AIHW 2016).
Smoking and alcohol cessation medicines
Data from the Pharmaceutical Benefits Scheme (PBS) provide information on the number of prescriptions dispensed and the number of patients supplied at least one script under the PBS within a given financial year. The PBS database includes information about medicines that are used to help people stop their smoking or alcohol consumption (smoking and alcohol cessation medicines).
Some smoking cessation medicines, such as Nicotine Replacement Therapies (NRT; for example, nicotine patches and gums), are available over-the-counter (OTC) as well as via a prescription. OTC NRT data are not captured in the PBS data as OTC medicines are not subsidised under the PBS. Refer to the Technical notes and Box PHARMS2 for more information.
Data from the PBS indicate that rates of dispensing of smoking and alcohol cessation medicines are consistently highest for people aged in their 40s, 50s and 60s (tables PBS66, PBS68, PBS82 and PBS84). In 2021–22:
- People aged 60–69 had the highest rates of smoking cessation medicine scripts dispensed followed by people aged 50–59. Conversely people aged 50–59 had the highest patient rates across all age groups followed by people aged 60–69.
- Males aged 60–69 had the highest rate of smoking cessation medicine scripts dispensed and patient rates of any group (around 2,600 scripts), while males 50–59 had the highest rate of patients who were dispensed a smoking cessation prescription (1,300 per 100,000 population).
- People aged 40–49 had the highest rates of alcohol cessation scripts dispensed and patient rates of any age group, followed by people aged 50–59.
- Males aged 40–49 had the highest rate of alcohol cessation medicine scripts dispensed and patient rates of any age group (around 970 scripts and 380 patients per 100,000 population) (tables PBS66, PBS68, PBS82 and PBS84).
Between 2012–13 and 2021–22, people in their 40s, 50s and 60s consistently had the highest dispensing rates for smoking and alcohol cessation medicines of any age group.
- Rates of smoking cessation medicine scripts dispensed fluctuated over time, but overall increased among people in their 50s and over. However, the rate of patients remained stable or declined for all age groups, apart from those in their 70s and those aged 80 and over where rates increased. This indicates that people in their 50s and 60s may be receiving an increasing number of scripts per patient across time.
- Rates of alcohol cessation medicine scripts dispensed and patients who received a supply of an alcohol cessation medicine increased across the period for people in their 40s and over (tables PBS66, PBS68, PBS82 and PBS84).
ABS (Australian Bureau of Statistics) (2018a). Deaths Due to Harmful Alcohol Consumption in Australia. ABS cat no. 3303.0. Canberra: ABS, accessed 22 November 2022.
ABS (2018b). National Health Survey, First Results, 2017-18. ABS cat. no. 4364.0.55.001. Canberra: ABS. Viewed 21 December 2018.
ABS (2022a). Causes of Death, Australia, 2022. ABS cat. no. 3303.0. Canberra: ABS. Viewed 13 October 2023.
Australian Bureau of Statistics (2022b) Population: Census. ABS Website, accessed 6 February 2024.
AIHW (Australian Institute of Health and Welfare) (2016). Exploring drug treatment and homelessness in Australia. Cat. No. CSI 23. Canberra: AIHW. Viewed 10 January 2018.
AIHW (2021). Australian Burden of Disease Study: Impact and causes of illness and death in Australia 2018, AIHW, Australian Government. doi:10.25816/5ps1-j259
AIHW (2023a). Alcohol and Other Drug Treatment Services annual report. Cat. No. HSE 250. Canberra: AIHW, accessed 21 June 2023.
AIHW (2023b). National Opioid Pharmacotherapy Statistics Annual Data collection. AIHW, accessed 20 April 2023.
AIHW (2023c) Older Australians. AIHW, Australian Government, accessed 06 February 2024.
AIHW (2024a) Alcohol and other drug treatment services in Australia: early insights. AIHW, Australian Government, accessed 16 April 2024.
AIHW (2024b) National Drug Strategy Household Survey 2022–2023. AIHW, accessed 06 February 2024.
DoH (Department of Health) (2017) National Drug Strategy 2017-2026. Canberra: Australian Government. Viewed 12 January 2018.
Chrzanowska A, Man N, Akhurst J, Sutherland R, Degenhardt L & Peacock A (2022). Trends in drug-related hospitalisations in Australia, 1999–2021. Drug Trends Bulletin Series. Sydney: National Drug and Alcohol Research Centre, UNSW, accessed 2 November 2022.
Chrzanowska A, Man N, Akhurst J, Sutherland R, Degenhardt, L Peacock A (2023). Trends in overdose and other drug-induced deaths in Australia, 2002-2021. Sydney: National Drug and Alcohol Research Centre, UNSW Sydney, accessed 4 May 2023.