The burden of obesity

Across all scenarios, burden attributable to obesity (BMI greater than or equal to 30 kg/m2) was greater than the burden attributable to overweight (but not obese) BMI (BMI between 25 and 30 kg/m2).

Using the stable scenario as the baseline, if the population living with obesity reduced their BMI by 1 kg/m2, the burden attributable to obesity could be reduced from 324,000 to 272,000 DALY (52,100 fewer DALY) and from 13,400 to 11,500 deaths (1,900 fewer deaths) (Figure 3). This avoidable burden is more than 4 times that of the potential reduction in burden attributable to living with overweight (but not obese) BMI (8,300 fewer DALY and 400 fewer deaths in the same scenario).

Compared with the stable scenario, the trend scenario shows an increase in burden attributable to obesity of 22% (or 72,000 DALY). Conversely, the trend scenario shows a decrease in burden attributable to the overweight (but not obese) category (a decrease of 4.2%, or 9,200 DALY). If current trends continued, 5.8% of total burden may be attributable to obesity compared with 4.8% in the stable scenario. This reflects the trend towards increased obesity prevalence in 2030 with obesity contributing an increasing proportion of disease burden if trends continued. This proportion decreases to 4% of total burden in the target scenario where BMI is reduced by 1 kg/m2.

The greater expected increase in 2030 for burden attributable to obesity compared with overweight (but not obese) BMI is seen across all age groups, and both males and females (trend scenario). However, the expected increase in obesity burden is greater among older age groups than younger age groups (40% increase in obesity burden for those aged 80 and over compared with 4% for those under 40).

Across all age groups and sexes, the target scenarios indicate that greater improvements in burden occur through reductions to obesity-related burden compared with overweight (but not obese) burden. While stabilising the rise in prevalence of living with overweight (including obesity) could lessen disease burden compared with current trends, these results indicate that the most effective interventions for reducing the loss of healthy years of life in 2030 would be those that target higher levels of BMI.

If the obese population were to reduce their BMI status to overweight (but not obese), an overall 89,300 DALY and 3,300 deaths could be prevented in 2030 compared with the stable scenario (Figure 2). While the burden attributable to living with overweight (but not obese) BMI increases in this scenario (107% increase as obesity burden is moved to the overweight but not obese category), there is an overall burden reduction across the population due to the burden attributable to obesity being reduced to zero.

If the obese population were to reduce their BMI status to a healthy level of BMI (that is, neither overweight nor obese), then 324,000 DALY and 13,400 deaths attributable to obese BMI could be prevented in 2030.

Among broad disease groups and in both target scenarios where BMI was reduced by 1 and 2 kg/m2, cardiovascular diseases were estimated to have the greatest reduction in burden attributable specifically to obesity. Endocrine disorders were estimated to have the highest percentage-point reduction in the proportion of burden attributable to obesity (a 3.5 percentage-point reduction in the scenario reducing BMI by 1 kg/m2).

Among specific causes, coronary heart disease was estimated to have the highest reduction in burden attributable specifically to obesity compared with the stable scenario (11,100 fewer obesity-related DALY in the target scenario reducing BMI by 1 kg/m2). Uterine cancer was estimated to have the highest percentage-point reduction in the proportion of burden attributable to obesity (a 5.6 percentage-point reduction in the same scenario).

See the Technical notes section for a detailed description of data sources and methods used to calculate attributable burden for each scenario.

Figure 3: Attributable burden in 2030, by BMI category

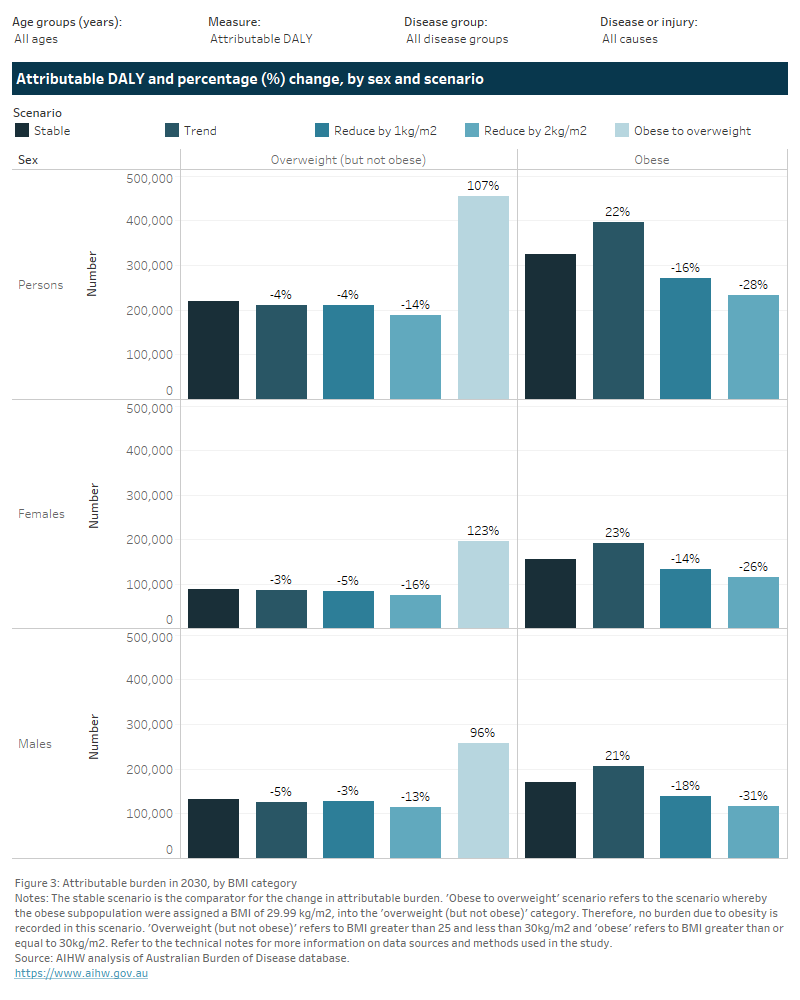
This figure presents two tabs of results on the changes in burden attributable to overweight (including obesity) in 2030 for each specific category of overweight (including obesity), by scenario relative to the stable scenario.

The first tab presents results by sex with two columns of results for each BMI category of overweight but not obese, and obesity. The second tab presents results by age.

Using the stable scenario as the baseline, if the population at risk reduced their BMI by 1 kg/m2, the burden attributable to obesity could be reduced from 324,000 to 272,000 DALY (52,100 fewer DALY) and from 13,400 to 11,500 deaths (1,900 fewer deaths) (Figure 3). This avoidable burden more than four times that of the potential reduction in burden attributable to living with overweight (but not obese) BMI (8,300 fewer DALY and 400 fewer deaths in the same scenario).

Compared with the stable scenario, the trend scenario shows an increase in burden attributable to obesity of 22% (or 72,000 DALY). Conversely, the trend scenario shows a decrease in burden attributable to the overweight (but not obese) category (a decrease of 4.2%, or 9,200 DALY). If current trends continued, 5.8% of total burden may be attributable to obesity compared with 4.8% in the stable scenario. This proportion decreases to 4% of total burden in the target scenario where BMI were to be reduced by 1 kg/m2.

The greater expected increase in 2030 for burden attributable to obesity compared with overweight (but not obese) BMI is seen across all age groups, and both males and females (trend scenario). However, the expected increase in obesity burden is greater among older age groups compared with younger age groups (40% increase in obesity burden for those aged 80 years and older compared with 4% for those under 40 years).

Across all age groups and sexes, the target scenarios indicate that greater improvements in burden occur through reductions to obesity-related burden compared with overweight (but not obese) burden.