What is the burden attributable to overweight (including obesity) in 2030?
If current trends in the prevalence of overweight (including obesity) continued through to 2030 (trend scenario), 8.9% of total burden may be attributable to overweight (including obesity) compared with 8% in the stable scenario (an increase of 0.9 percentage points). This proportion decreases to 7.1% of total burden in the target scenario where BMI would be reduced by 1 kg/m2 (a 0.9 percentage-point reduction compared with the stable scenario). If current trends continued, attributable disease burden and deaths could be 12% (62,900 DALY) and 16% (3,800 deaths) higher, respectively, compared with the stable scenario (Figure 2).
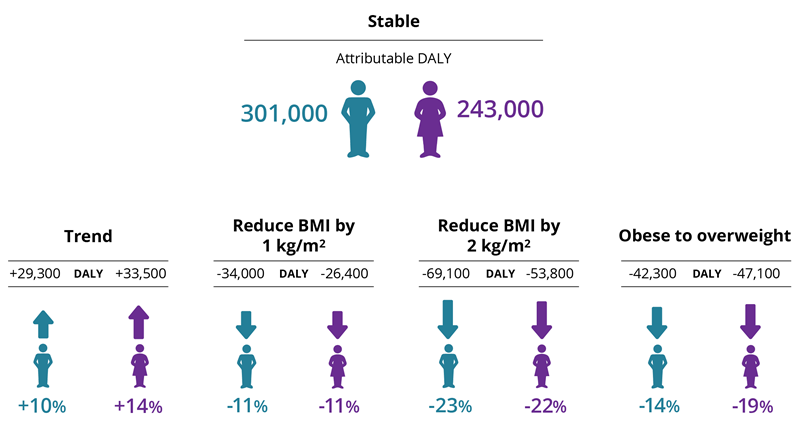
If everyone in the population at risk in 2017–2018 were to reduce their BMI by 1 kg/m2, and these rates were maintained to 2030, disease burden and deaths attributable to overweight (including obesity) could fall by 11% (60,400 DALY) and 10% (2,300 deaths), respectively, compared with the stable scenario. This decreases further to 23% (123,000 DALY) and 22% (5,300 deaths) in the scenario where BMI is reduced by 2 kg/m2.
If those in the obese population were to reduce their BMI only to overweight status (that is, if there was no obesity in the population), 16% (89,300 DALY) of future attributable burden and 14% (3,300 deaths) of attributable deaths could be avoided in 2030. Changes in attributable burden also differ between males and females.
Image: Changes in attributable burden, by sex and scenario
Older age groups experience greater overall burden attributable to overweight (including obesity) as many linked diseases are age-related. This means that older Australians also have the greatest potential gains under the target scenarios. For example, if the obese population were to reduce their BMI status to overweight (but not obese), with all else being equal, 29,100 DALY and 1,200 deaths could be prevented in 2030 (compared with the stable scenario) among those aged 70 to 79, compared with an estimated 5,100 DALY and 22 deaths that could be prevented in those aged under 40.
While younger age groups showed greater relative reductions of burden in the target scenarios, greater amounts of potential burden could be prevented among older age groups, who experience larger overall disease burden. However, there may be further improvements in longer-term health from addressing overweight (including obesity) among younger age groups, including impacts on other risk factors not measured here.
Among broad disease groups, cardiovascular diseases were estimated to have the greatest potential reduction in burden attributable to overweight (including obesity) with 20,100 DALY (11% fewer) and 1,000 deaths (10% fewer) avoided in 2030 in the scenario where the population at risk reduced their BMI by 1 kg/m2 compared with the stable scenario.
Among specific causes, coronary heart disease had the greatest potential reduction, of 12,600 DALY and 660 deaths avoided in 2030 in the same scenario.
Across all target scenarios, endocrine disorders (which includes diabetes) were estimated to have the highest percentage-point reduction in the proportion of total burden attributable to overweight (including obesity).
Among specific causes, uterine cancer had the highest estimated percentage-point reduction of total burden attributable to overweight (including obesity) in all target scenarios.
Among older age groups, cardiovascular diseases as a group of diseases were estimated to have the greatest potential reduction in burden. For example, for the scenario where the population reduced their BMI by 1 kg/m2, 3,200 DALY and almost 400 deaths could be avoided in those aged 80 and older. However, among specific causes, dementia had the greatest estimated potential reduction in burden in the same scenario for this age group (2,500 fewer DALY and 250 fewer deaths).
See the Technical notes section for a detailed description of data sources and methods used to calculate attributable burden for each scenario.
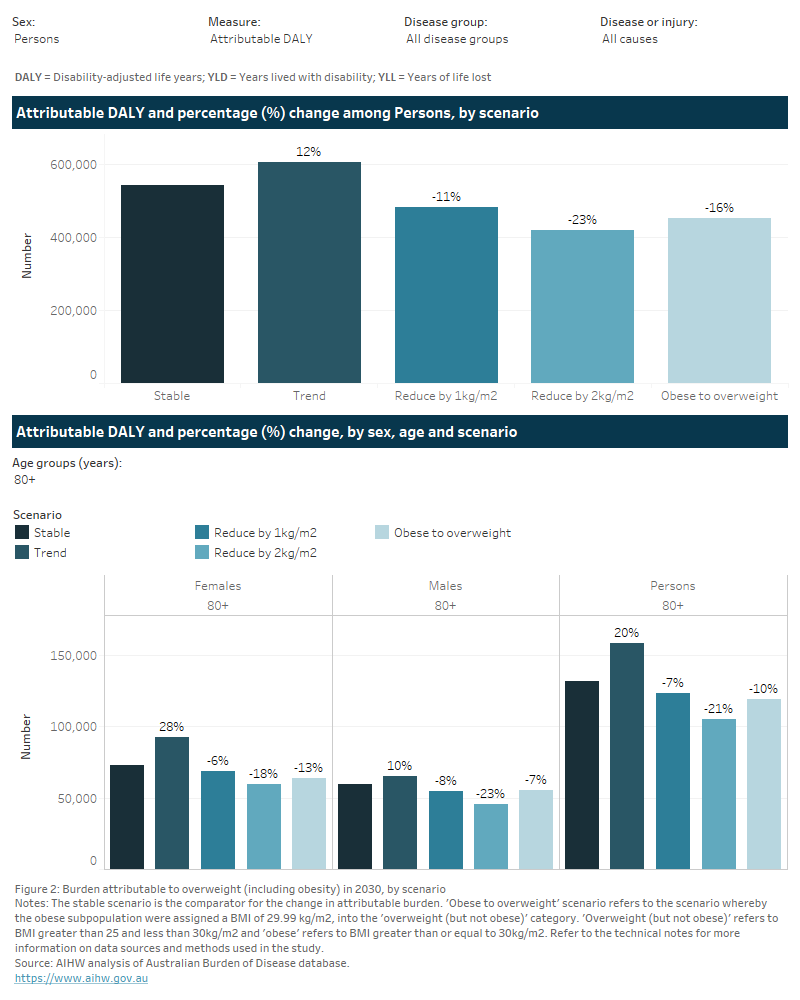
Figure 2: Burden attributable to overweight (including obesity) in 2030, by scenario
This figure represents two bar charts on the changes in burden attributable to overweight (including obesity) in 2030, by scenario, relative to the stable scenario.
The first bar chart presents these results for all ages. If current trends in the prevalence of overweight (including obesity) continued to 2030, attributable burden and deaths could be 12% (62,900 DALY) and 16% (3,800 deaths) higher, respectively, compared with the stable scenario. If everyone in the population at risk in 2017–18 were to reduce their BMI by 1 kg/m2, and these rates were maintained to 2030, disease burden and deaths attributable to overweight (including obesity) could fall by 11% (60,400 DALY) and 10% (2,300 deaths), respectively, compared with the stable scenario. This decreases further to 23% (123,000 DALY) and 22% (5,300 deaths) in the scenario where BMI were reduced by 2 kg/m2. If those in the obese population only were to reduce their BMI to overweight status (that is, if there was no obesity in the population), 16% (89,300 DALY) of future attributable burden and 14% (3,300 deaths) of attributable deaths could be avoided in 2030.
The second bar chart presents results for specific age groups. Older age groups experience greater overall burden attributable to overweight (including obesity). If the obese population were to reduce their BMI status to overweight (but not obese), with all else being equal, 29,100 DALY and 1,200 deaths could be prevented in 2030 (compared with the stable scenario) among those aged 70 to 79 years, compared with an estimated 5,100 DALY and 22 deaths that could be prevented in those aged under 40.
There are filters that allow the user to select these results for different burden of disease measures, disease groups and specific causes. Among broad disease groups, cardiovascular diseases were estimated to have the greatest potential reduction in burden attributable to overweight (including obesity) with 20,100 DALY (11% fewer) and 1,000 deaths (10% fewer) avoided in 2030 in the scenario where the population at risk reduced their BMI by 1 kg/m2 compared with the stable scenario. Among specific causes, coronary heart disease had the greatest potential reduction of 12,600 DALY and 700 deaths avoided in 2030 in the same scenario.