What is the burden attributable to physical inactivity by 2030?
If everyone in the population at risk did the equivalent of an extra hour of moderate-intensity activity per week, and this activity was maintained to 2030, 2.2% of total burden could be attributable to physical inactivity compared with 2.6% in the stable scenario (a decrease of 0.4 percentage points). If everyone in the population at risk did an extra hour of moderate-intensity activity (such as taking a brisk walk) per week, attributable burden and deaths could fall by 16% (28,300 DALY) and 13% (1,500 deaths), respectively, compared with the stable scenario.
Among males, with an additional hour of moderate-intensity exercise per week, 17% (15,500 DALY) of the burden and 14% (750 deaths) of deaths attributable to physical inactivity could potentially be avoided in 2030 compared with the stable scenario. For females, attributable burden and deaths could fall by 14% (12,800 DALY) and 12% (740 deaths) in the same scenario.
For those aged under 35, the equivalent of an additional hour of moderate activity per week, could reduce attributable burden in 2030 by 46% (3,000 DALY) compared with the stable scenario. This is due to the relatively small overall burden experienced in these age groups. In comparison, for those aged 80 and over, there was a 12% reduction in burden for the same scenario, though this amounts to a decrease of 8,500 attributable DALY.
While younger age groups showed greater relative reductions of burden in scenarios of additional exercise, greater absolute amounts of potential burden could be prevented among older age groups, who experience larger overall disease burden. However, there may be further improvements in longer-term health from addressing inactivity among younger age groups.
Among broad disease groups, cardiovascular diseases were estimated to have the greatest potential reduction in burden attributable to physical inactivity, with 15,600 DALY (21% fewer) and 1,300 deaths (21% fewer) avoided in 2030 if the population at risk did an extra hour of moderate activity per week compared with the stable scenario. The disease group of mental health conditions and substance use disorders had the next highest potential reduction in burden attributable to physical inactivity, with 8,800 DALY avoided (47% fewer).
Among specific causes, the largest amount of attributable burden that could be prevented was associated with coronary heart disease (11,700 DALY and 930 deaths in the scenario of an additional hour of activity per week). This was followed by depressive disorders with 8,800 DALY avoided in the same scenario.
Target scenarios with increased physical activity produce a larger reduction in attributable burden. If the population did the equivalent of an extra 15 minutes of activity, 5 days a week, 18% (32,100 DALY) of attributable burden and 15% (1,600 deaths) of attributable deaths in 2030 could be avoided compared with the stable scenario. If the amount of additional activity increased to 30 minutes, 5 days a week, 31% (55,700 DALY) of future attributable burden and 29% (3,300 deaths) of attributable deaths could be avoided. If the amount of additional activity increased further to 60 minutes, 5 days a week, 49% (87,600 DALY) of future attributable burden and 47% (5,300 deaths) of attributable deaths could be avoided.
See the Technical notes section for a detailed description of data sources and methods used to calculate attributable burden for each scenario.
Figure 5: Burden attributable to physical inactivity in 2030, by scenario
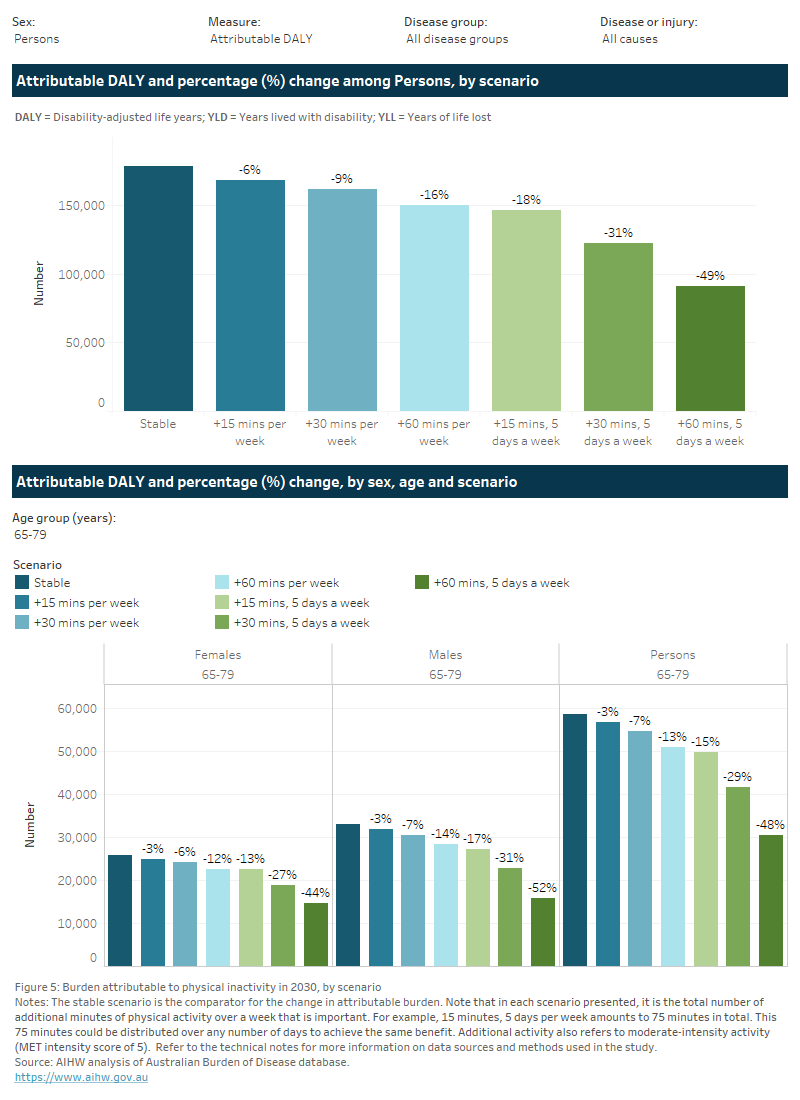
This figure represents two bar charts on the changes in burden attributable to physical inactivity in 2030, by scenario, relative to the stable scenario.
The first bar chart presents these results for all ages. If everyone in the population at risk did the equivalent of an extra 15 minutes of moderate-intensity activity, 5 days a week, and this activity was maintained to 2030, 2.2% of total burden could be attributable to physical inactivity compared with 2.6% in the stable scenario (a decrease of 0.5 percentage points). If everyone in the population at risk did an extra 15 minutes of moderate-intensity activity, 5 days a week, attributable burden and deaths could fall by 18% (32,100 DALY) and 15% (1,600 deaths), respectively, compared with the stable scenario.
The second bar chart presents results for specific age groups. For those aged under 35 years, the equivalent of an additional 15 minutes of moderate activity, 5 days a week, could reduce attributable burden in 2030 by 50% (3,200 DALY) compared with the stable scenario. This is due to the relatively small overall burden experienced in these age groups. In comparison, for those aged 80 years and over, there was a 13% reduction in burden for the same scenario, though this amounts to a decrease of 9,300 attributable DALY.
There are filters that allow the user to select these results for different burden of disease measures, disease groups and specific causes. Among broad disease groups, cardiovascular diseases were estimated to have the greatest potential reduction in burden attributable to physical inactivity, with 17,700 DALY (24% fewer) and 1,400 deaths (23% fewer) avoided in 2030 if the population at risk did an extra 15 minutes of moderate activity, 5 days a week compared with the stable scenario. Among specific causes, the largest amount of attributable burden that could be prevented was associated with coronary heart disease (13,500 DALY and 1,000 deaths in the scenario of an additional 15 minutes, 5 days per week).

- Use the drop-down lists at the top of the visualisation to filter the data by measure of disease burden, year, sex, disease group and disease/injury.
- Hover over the bars or coloured tiles on the charts for additional information.
- The toolbar at the bottom of the visualisation enables users to interact with the data in different ways:
- Undo = Undo the latest filter applied.
- Redo = Redo the latest filter applied.
- Revert = Clears all filters applied and reverts visualisation to default filters.
- Refresh = Connects to the underlying data source and updates the visualisation with any changes in the data (not applicable to this visualisation).
- Pause = Stops the visualisation from updating each time a filter is changed, enabling multiple filters to be changed at once. Clicking ‘Resume’ will update the visualisation according to the selected filters.
- Share = Generates a link that can be shared (note that filters will not be applied when link is shared).
- Download = Allows a downloadable file as either an image (PNG), PDF or PowerPoint file. This is a useful way to save a snapshot of the visualisation to include in a document or presentation.
- Full screen = Displays the dashboard in full screen mode (press Esc to return to original view).