Cumulative follow-ups
On this page:
Explore the data in the visualisation below.
Notes
- This section reflects the number of follow-up services that patients received in the 12 months following their health check, in terms of patient counts and proportions, by the year that their health check was delivered.
- Some records from a small number of service providers have been excluded due to data quality concerns.
Latest data
Among the 237,000 people who had a First Nations health check in 2020–21:
- 46% (109,200 patients) received at least one First Nations follow-up within 12 months of their health check.
- 26% (60,600 patients) received at least 2 follow‑ups.
- 16% (38,400 patients) received at least 3 follow‑ups.
- 11% (25,900 patients) received at least 4 follow‑ups.
- 7.7% (18,200 patients) received at least 5 follow‑ups.
By category of follow-up
Among the 237,000 people who had a First Nations health check in 2020–21:
- 42% (98,900 patients) received at least one follow-up from an Aboriginal and Torres Strait Islander Health Practitioner or Practice Nurse within 12 months of their health check (on behalf of a GP).
- 21% (49,900 patients) received at least 2 follow‑ups from an Aboriginal and Torres Strait Islander Health Practitioner or Practice Nurse within 12 months of their health check (on behalf of a GP).
- 11% (26,600 patients) received at least one follow-up from an eligible allied health professional within 12 months of their health check (with referral from a GP).
- 5.9% (14,000 patients) received at least 2 follow‑ups from an eligible allied health professional within 12 months of their health check (with referral from a GP).
Trends over time
Among health check patients from 2011–12 to 2020–21:
- The proportion of patients who received at least 2 follow-up services within 12 months of their health check increased gradually from 9.0% for 2011–12 to 27% for 2018–19 (8,600 patients to 65,500 for respective years). The proportion then plateaued from 2018–19 to 2020–21.
- The proportion of patients who received at least one follow-up from an Aboriginal and Torres Strait Islander Health Practitioner or Practice Nurse (on behalf of a GP) within 12 months increased gradually from 15% for 2011–12 to 43% for 2018–19 (14,500 patients to 103,600 for respective years). The proportion then plateaued from 2018–19 to 2020–21.
- The proportion of patients who received at least one follow-up from an eligible allied health professional (with referral from a GP) within 12 months increased gradually from 4.5% for 2011–12 to 11% for 2016–17 (4,200 patients to 22,800 for respective years). The proportion then plateaued from 2016–17 to 2020–21.
Figure 28: First Nations health check patients, by number of follow-up services in the 12 months following their health checks, 2011–12 to 2020–21
A set of interactive graphs over 2 tabs. Refer to table FS12 in data tables. A long description is available below.
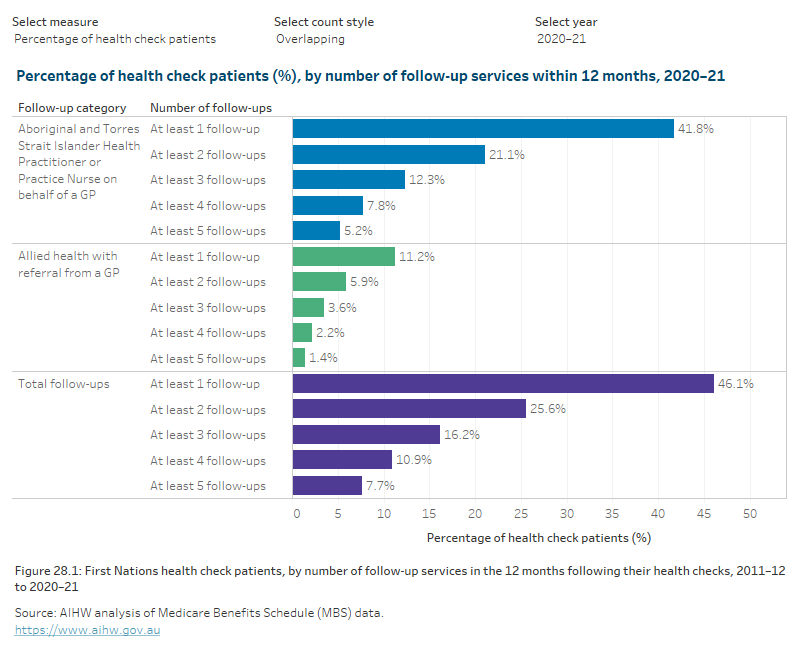
A set of interactive graphs over 2 tabs. The first is a bar graph showing the cumulative number of follow-up services within 12 months among those patients who had a health check, by type of follow-up service. The second is a line graph showing cumulative numbers of follow-ups trending up between 2011–12 and 2018–19, then plateauing to 2020–21. Refer to table FS12 in data tables.