National use of health checks
On this page:
Explore the data in the visualisation below.
Latest data
In 2021–22:
- 209,000 people had a First Nations health check.
- 24% of the First Nations population projection had a health check.
By sex
In 2021–22:
- 25% of females had a health check (113,000 patients).
- 22% of males had a health check (95,500 patients).
By age
In 2021–22:
- Uptake of health checks generally increased with age, after an initial decline.
- People aged 75 years and over had the highest uptake of health checks, at 36% (5,000 patients).
- People aged 15–24 years had the lowest uptake of health checks, at 19% (31,700 patients).
By age and sex
In 2021–22:
- Males aged 15–24 had the lowest uptake of health checks of any male or female age group, at 15%.
- Females had higher uptake of health checks than males in nearly every age group. Males had slightly higher uptake in age groups, 0–4 and 5–14.
- People aged 25–34 had the highest difference in health check uptake between males and females, at 16% for males and 25% for females.
- Age groups, 0–4 and 75 and over, had the smallest differences in health check uptake between males and females.
Trends over time
Between 2011–12 and 2021–22:
- The proportion of people who had a health check increased from 13% in 2011–12 to 29% in 2018–19 (94,800 and 241,000 patients in respective years).
- Since 2018–19, the proportion who had a health check dropped each year – from 29% in 2018–19 to 24% in 2021–22 (or 241,000 patients to 209,000 patients).
- The drop was particularly sharp in 2021–22, changing from 27% in 2020–21 (237,000 patients).
- A higher proportion of females had a health check in each year, compared with males.
- Younger age groups had relatively large falls in health check uptake since 2018–19, compared with older age groups.
Figure 1: Use of First Nations health checks, by age group, by sex, 2011–12 to 2021–22
A set of interactive graphs over 4 tabs. Refer to table HC01 in data tables. A long description is available below.
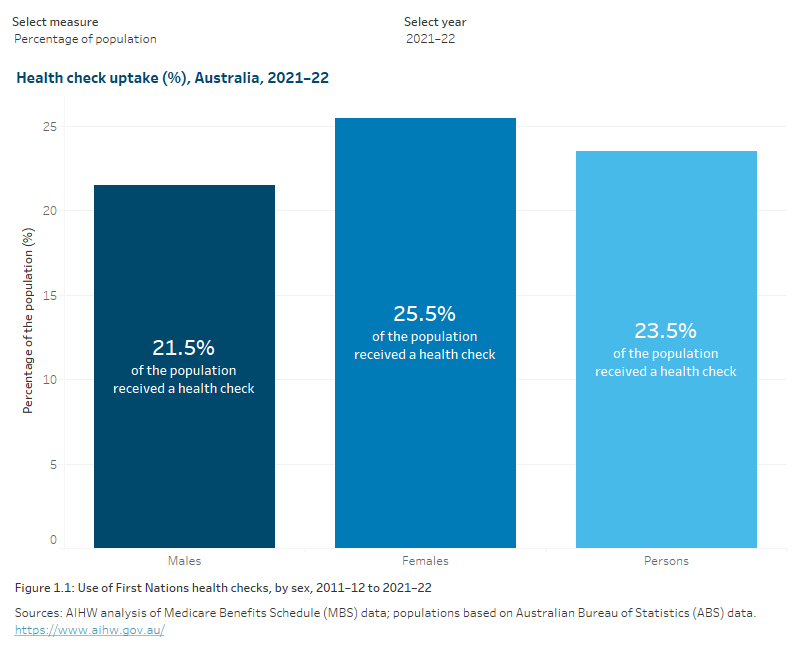
A set of interactive graphs over 4 tabs. The first is a column graph showing uptake of health checks by sex, showing females had higher uptake of health checks in 2021–22. The second is a column graph showing uptake of health checks increasing by age in 2021–22. The third is a line graph showing uptake by sex trending up from 2011–12 to 2018–19, then trending down to 2021–22. The fourth is a line graph showing uptake by age group trending up from 2011–12 to 2018–19, then trending down to 2021–22. Refer to table HC01 in data tables.