Indigenous Region (IREG) comparisons
On this page:
Explore the data in the visualisation below.
Geographic information
This analysis is based on the postcode of the patient’s given mailing address. As a result, the data may not always reflect where the person actually lived – particularly for people who use PO boxes. This is likely to impact some areas more than others and will also have a generally greater impact on the accuracy of smaller geographic areas.
Latest data
In 2021–22:
- Alice Springs had the highest uptake of health checks, at 40% (2,800 patients).
- Melbourne had the lowest uptake of health checks, at 7.8% (2,500 patients).
Trends over time
Between 2016–17 and 2021–22:
- In three-quarters of IREGs (28 out of 37), the proportion of people receiving a health check was lower in 2021–22 compared with 2016–17, after an initial rise in uptake.
- Tasmania had the largest percentage-point increase in health check uptake, rising from 10% in 2016–17 to 14% by 2021–22 (2,900 patients to 4,500 in respective years).
- Alice Springs had the largest percentage-point decrease in health check update, falling from 71% in 2017–18 to 40% in 2021–22 (4,900 patients to 2,800 in respective years).
Figure 6: Use of First Nations health checks, by Indigenous Region (IREG), 2016–17 to 2021–22
A set of interactive graphs over 3 tabs. Refer to table HC06 in data tables. A long description is available below.
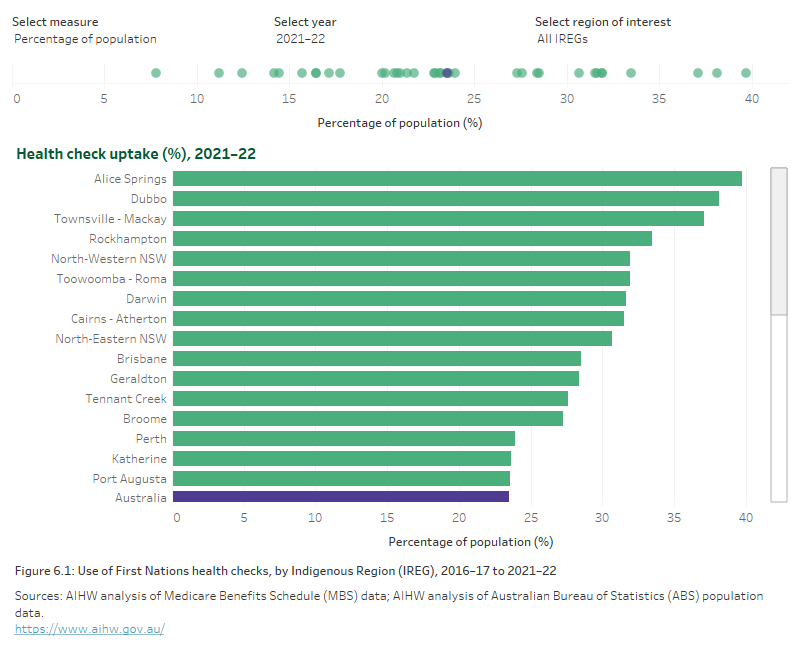
A set of interactive graphs over 3 tabs. The first is a bar graph showing uptake of health checks by IREG, showing Alice Springs was the IREG with the highest health check uptake in 2021–22. The second shows health check update by IREG on a map. The third is a line graph showing the varying uptake in health checks by IREG from 2016–17 to 2021–22, generally decreasing in the last year. Refer to table HC06 in data tables.