State and territory comparisons
On this page:
Explore the data in the visualisation below.
Geographic information
This analysis is based on the postcode of the patient’s given mailing address. As a result, the data may not always reflect where the person actually lived – particularly for people who use PO boxes. This is likely to impact some areas more than others and will also have a generally greater impact on the accuracy of smaller geographic areas.
Latest data
In 2021–22:
- Queensland had the highest uptake of health checks, at 30% (75,200 patients).
- Victoria had the lowest uptake of health checks, at 11% (7,300 patients).
By age
In 2021–22:
- People aged 55 and over were the age group with the highest uptake of health checks in every state and territory.
- Tasmania had the widest range in uptake across age groups, with 7.8% among 5–14-year-olds and 29% among those aged 55 and over.
Trends over time
Between 2016–17 and 2021–22:
- In most states and territories, the proportion of people receiving a health check was lower in 2021–22 compared with 2016–17, after an initial rise in uptake.
- Tasmania had the largest percentage-point increase in health check uptake, rising from 10% in 2016–17 to 14% by 2021–22 (2,900 patients to 4,500 in respective years).
- Tasmania’s health check uptake surpassed that of Victoria and the Australian Capital Territory in recent years.
- The Northern Territory had the largest percentage-point decrease in health check uptake, falling from 37% in 2017–18 to 25% in 2021–22 (28,100 patients to 20,000 in respective years).
Figure 2: Use of First Nations health checks, by state and territory, by age group, 2016–17 to 2021–22
A set of interactive graphs over 4 tabs. Refer to table HC02 in data tables. A long description is available below.
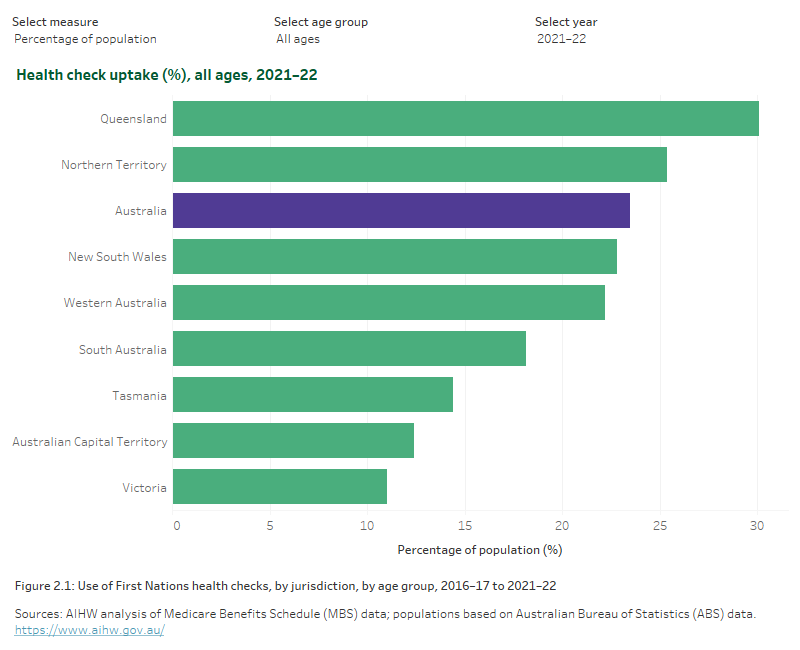
A set of interactive graphs over 4 tabs. The first is a bar graph showing uptake of health checks by jurisdiction, showing Queensland had the highest health check uptake in 2021–22. The second is a column graph showing uptake of health checks by age group, showing health check uptake was lowest among those aged 5–24 in 2021–22. The third is a line graph showing the varying uptake in health checks by jurisdiction from 2016–17 to 2021–22, decreasing across all jurisdictions from 2020–21 to 2021–22. The fourth is a line graph showing uptake of health checks by age group trending up from 2016–17 to 2018–19, then trending down to 2021–22. Refer to table HC02 in data tables.