Cumulative health checks
On this page:
Explore the data in the visualisation below.
Notes
- Patients are counted by their number of health checks across 5-years.
- For comparisons by sex or by state and territory, patients are presented as a proportion of the estimated population at the end of the 5-years, and alternatively as a proportion of the total number of health check patients over 5-years.
- State or territory of residence was based on information from the most recent health check in the 5-year period. Patients may have received some or most of their earlier health checks in a different state or territory.
- Limitations: Some patients counted over the 5-years may have died or moved abroad, therefore proportions of the population may be overestimated. Children under 5 years old also skew the results, since they were born partway through the reference period.
Geographic information
This analysis is based on the postcode of the patient’s given mailing address. As a result, the data may not always reflect where the person actually lived – particularly for people who use PO boxes. This is likely to impact some areas more than others and more than others and will also have a generally greater impact on the accuracy of smaller geographic areas.
National data
Between July 2017 and June 2022:
- 560,000 First Nations people received at least one First Nations health check (equivalent to 63% of the projected population at 30 June 2022).
- The majority of those health check patients (59%) received at least 2 health checks over the 5-year period (330,000 out of 560,000).
- 15% of health check patients received 4 or more health checks over the 5-year period (85,000 out of 560,000).
By sex
Between July 2017 and June 2022:
- 294,000 (66%) of First Nations females received at least one health check.
- 267,000 (60%) of First Nations males received at least one health check.
Trends over time
Between July 2012 and June 2022:
- The proportion of the projected population who received at least one health check increased from 53% in the 5-year period ending 30 June 2017 to 63% in the 5-year period ending 30 June 2022 (428,000 patients, and 560,000, for the respective periods).
- Among those who had at least one health check, the proportion who received 2 or more health checks increased from 55% in the 5-year period ending 30 June 2017 to 59% in the 5-year period ending 30 June 2022 (237,000 patients, and 330,000, for the respective periods).
Figure 10: First Nations health check patients, by number of health checks over a 5-year period, by sex, July 2012 to June 2022
A set of interactive graphs over 3 tabs. Refer to table HC10 in data tables. A long description is available below.
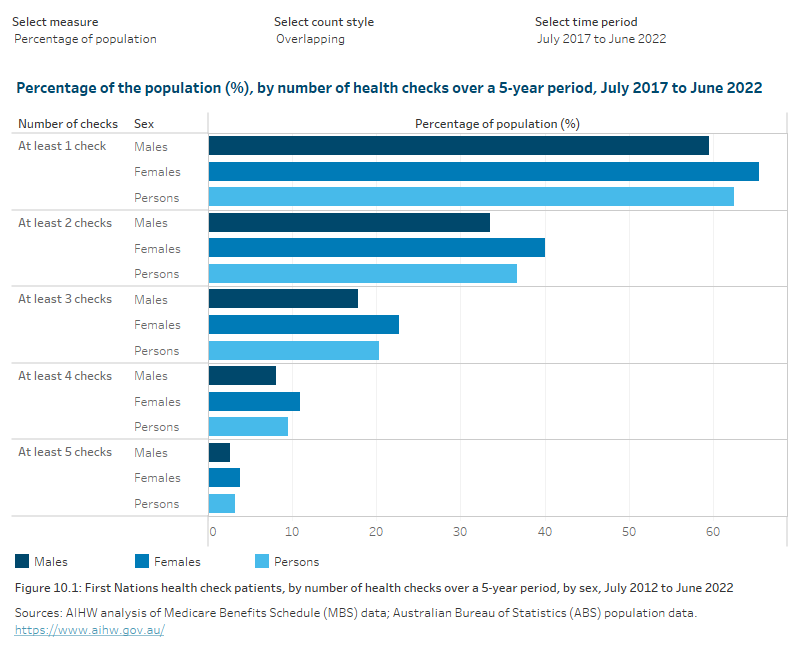
A set of interactive graphs over 3 tabs. The first is a bar graph showing the collective number of health checks received by patients over a period of 5 years, by sex. More than half of the First Nations population had at least one health check between July 2017 and June 2022. The second tab shows a line graph, following the use of health checks over 5-year periods by sex, starting at July 2012 to June 2017 and ending at July 2017 to June 2022. Collective health check use trended up in each 5-year period until July 2016 to June 2021, then decreased slightly for the period of July 2017 to June 2022. The third tab shows a line graph, with separate lines for each number of health checks received over 5 years, starting at July 2012 to June 2017 and ending at July 2017 to June 2022. There was little variation in how many people would have 5 or more health checks over a 5-year period, however, the proportion of people who had at least one health check during a 5-year period increased by 10 percentage points. Refer to table HC10 in data tables.
States and territories
Between July 2017 and June 2022:
- The Northern Territory had the highest proportion of people who had at least one health check, at 76% (59,700 patients).
- Tasmania had the lowest proportion of people who had at least one health check, at 36% (11,300 patients).
Trends over time
Between July 2012 and June 2022:
- The proportion of the projected population who received at least one health check increased in all states and territories from the 5-year period ending 30 June 2017 to the 5-year period ending 30 June 2022.
- Tasmania had the largest percentage-point increase in the proportion of the population who received at least one health check, rising from 20% in the 5-year period ending 30 June 2017 to 36% in the 5-year period ending 30 June 2022 (5,800 patients to 11,300, for the respective periods).
- The Northern Territory had the smallest percentage-point increase in the proportion of the population who received at least one health check, rising from 71% in the 5-year period ending 30 June 2017 to 76% in the 5-year period ending 30 June 2022 (53,800 patients to 59,700, for the respective periods).
- In the Australian Capital Territory, the proportion of total health check patients who received at 3 health checks over 5 years decreased from 35% at 30 June 2019 to 26% at 30 June 2022 (1,400 patients to 1,100, for the respective periods).
Figure 11: First Nations health check patients, by number of health checks over a 5-year period, by state and territory, July 2012 to June 2022
A set of interactive graphs over 4 tabs. Refer to table HC11 in data tables. A long description is available below.
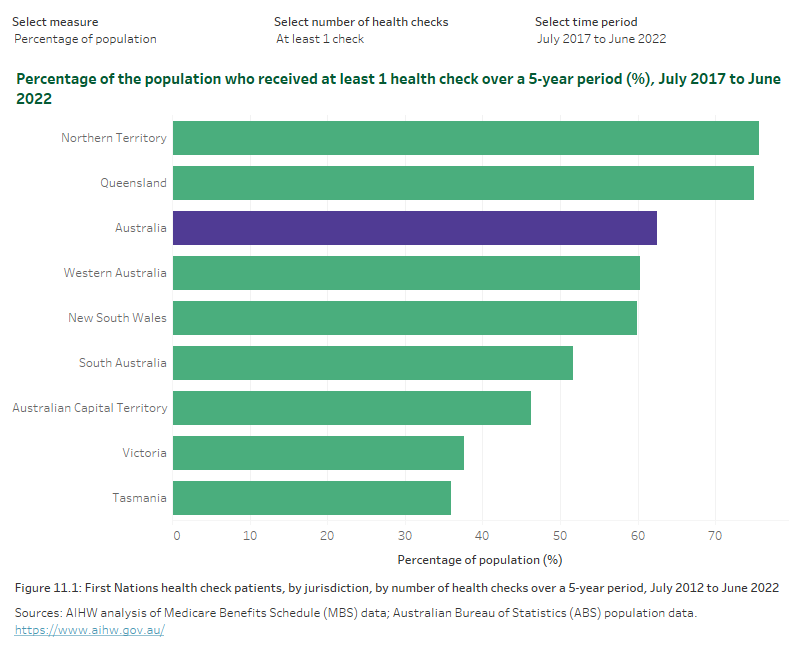
A set of interactive graphs over 4 tabs. The first is a bar graph showing cumulative health checks over a 5-year period by jurisdiction, showing Northern Territory had the highest collective health check use between July 2017 and June 2022. The second is a bar graph showing the number of health checks had over a 5-year period within a selected jurisdiction, showing more than half of the First Nations population had at least one health check between July 2017 and June 2022. The third is a line graph, showing the cumulative use of health checks by jurisdiction in 5-year periods, starting at July 2012 to June 2017 and ending at July 2017 to June 2022. Collective health check use generally trended up, with only a few jurisdictions trending down in the more recent 5-year periods. The fourth is a line graph, showing separate lines for each number of health checks received over 5-year periods, starting at July 2012 to June 2017 and ending at July 2017 to June 2022. Refer to table HC11 in data tables.