Deaths among adults aged 25–44
There were 5,112 deaths among people aged 25–44 in 2012 and this equates to a rate of 79 deaths per 100,000 population aged 25–44, or 1 death per 1,267 people. The death rate decreased by 29% since 1997, from 111 deaths per 100,000 to 79 deaths per 100,000 (Figure 7.1).
More than two-thirds (69%) of deaths in this age group are considered potentially avoidable, including all of the top 5 causes of premature mortality.
Figure 7.1: Death rates among adults aged 25–44, by sex, 1997–2012
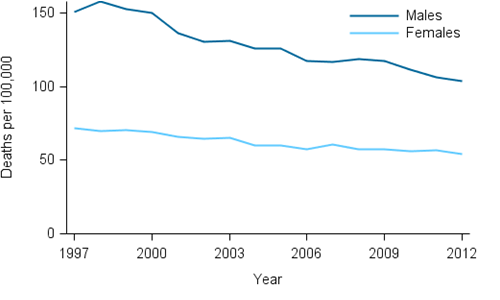
Source: AIHW National Mortality Database (Table S1, 524KB XLS).
Suicide was the leading cause of death among people aged 25–44, accounting for 18% of deaths in 2010–2012, followed by accidental poisoning (9.8%) and land transport accidents (8.5%) (Table 7.1).
Coronary heart disease was the 4th leading cause of death among people aged 25–44 (accounting for 5.5% of deaths). More than 4 in 5 deaths due to coronary heart disease in this age group were men.
Breast cancer was the 2nd leading cause of death among women aged 25–44, after suicide, and the 5th leading cause for both sexes combined.
Table 7.1: Leading causes of death among adults aged 25–44, 2010–2012
| Rank | Cause of death | Deaths | Per cent |
|---|---|---|---|
| 1 | Suicide (injury) see fact sheet and GRIM book. |
2,860 |  18.4 |
| 2 | Accidental poisoning (injury) see fact sheet and GRIM book. |
1,521 |  9.8 |
| 3 | Land transport accidents (injury) see fact sheet and GRIM book. |
1,328 | 8.5 |
| 4 | Chronic heart disease (chronic) see fact sheet and GRIM book. |
851 |  5.5 |
| 5 | Breast cancer (cancer) see fact sheet and GRIM book. |
472 |  3.0 |
Notes:
- Colours indicate broad cause of death category.
blue = chronic disease, orange = cancer, purple = injury & poisoning, green = other cause of death. - Injury and poisoning death data should be interpreted with caution due to the potential for revision (see Source data).
Source: AIHW National Mortality Database (Table S2, 524KB XLS).