Deaths among young people aged 15–24
In 2012, there were 1,203 deaths among young people aged 15–24 of which 820 (68%) were deaths among males. This age group saw the greatest reduction in premature mortality in the last 16 years. The death rate fell by 47%, from 74 deaths per 100,000 population aged 15-24 in 1997 to 39 per 100,000 in 2012 (Figure 6.1).
More than three-quarters (76%) of deaths among young people aged 15–24 were considered potentially avoidable, including all of the top 5 leading causes of death for this age group.
Figure 6.1: Death rates among young people aged 15–24, by sex, 1997–2012
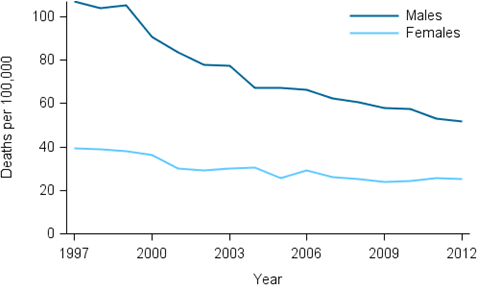
Source: AIHW National Mortality Database (Table S1, 524KB XLS).
The 5 leading causes of death among people aged 15–24 were due to injury and poisoning or due to ill-defined causes (Table 6.1).
Suicide (26%) and land transport accidents (25%) each accounted for about one-quarter of deaths in this age group in 2010–2012.
Land transport accidents were the leading cause of death among males. These accidents were also the leading cause of death in 1997–1999 but the rate has nearly halved since then (from 20 per 100,000 in 1997–1999 to 11 per 100,000 in 2011–12).
The suicide rate for 15–24 year olds has decreased by 39% since 1997–1999, despite being the leading cause of premature death in 2010–2012.
Accidental poisoning was the 3rd leading cause of death in this age group. This category includes drug overdoses.
Assault was the 4th leading cause of death in this age group and 28% of victims of fatal assault were female.
Cause of death information for 2011 and 2012 are subject to further revision. In particular, some of the deaths classified as events of undetermined intent are likely to be re-coded to more specific injury and poisoning causes. This may affect the size of the change in premature mortality rates between 1997–1999 and 2010–2012.
In addition to the revisions process, coding changes were introduced in 2007 to enable deaths to be coded to suicide if evidence indicates the death was from intentional self-harm. This means that in addition to coroner-determined suicides, deaths may also be coded to suicide following further investigation of information on the National Coronial Information System.
For more information, see Source data.
Table 6.1: Leading causes of death among young people aged 15–24, 2010–2012
| Rank | Cause of death | Deaths | Per cent |
|---|---|---|---|
| 1 | Suicide (injury) see fact sheet and GRIM book. |
964 |  26.2 |
| 2 | Land transport accidents (injury) see fact sheet and GRIM book. |
933 | 25.3 |
| 3 | Accidental poisoning (injury) see fact sheet and GRIM book. |
189 |  5.1 |
| 4 | Assault (injury) see fact sheet and GRIM book. |
111 |  3.0 |
| 5 | Event of undetermined intent (injury) | 95 |  2.6 |
Notes:
- Colours indicate broad cause of death category.
blue = chronic disease, orange = cancer, purple = injury & poisoning, green = other cause of death. - Injury and poisoning death data should be interpreted with caution due to the potential for revision (see Source data).
Source: AIHW National Mortality Database (Table S2, 524KB XLS).