International comparisons of premature mortality
Premature mortality statistics are useful for comparing the health status of different countries. Mortality rates in different countries can be influenced by broad social and economic factors, such as education and income, as well as medical and pharmaceutical advances targeting specific causes of death, and public policy.
The World Health Organization (WHO) and the Organisation for Economic Cooperation and Development (OECD) report on premature mortality. The measures used may differ from those reported within Australia reflecting differences in the populations being compared. For example, both WHO and OECD use the age of 70 (not 75) as the cut-off for premature deaths reflecting that median age at death and life expectancy may be lower in some countries.
There are numerous reports published by national and international organisations that present international comparisons of health. A working guide to international comparisons of health (PHE 159) (AIHW 2012) provides a general guide to reporting, interpreting and understanding comparisons.
World Health Organisation (WHO)
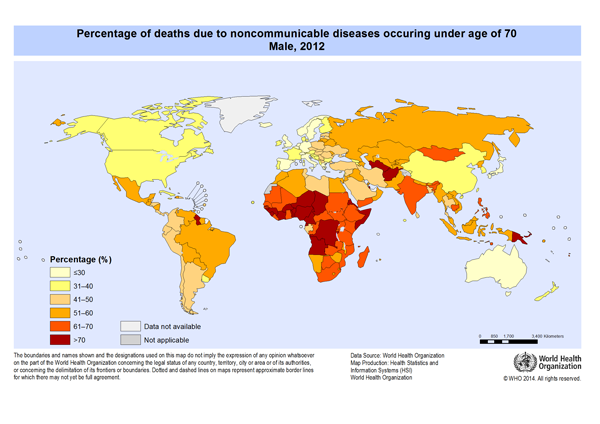
WHO report on premature mortality as the percentage of all non-communicable—or chronic—disease deaths occurring in those aged under 70 (Figure 11.1). Non-communicable diseases are defined by WHO as diseases of long duration and generally slow progression, including cardiovascular diseases, cancer, respiratory diseases and diabetes. Communicable diseases such as lower respiratory infections, HIV/AIDS and diarrhoeal diseases are excluded because they are leading causes of death in low-income countries and may distort comparison with middle and high-income countries.
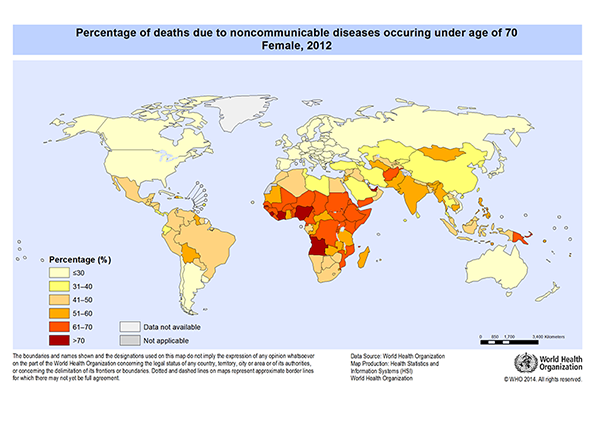
In 2012, 28% of non-communicable deaths among Australian males occurred under the age of 70. Australian males ranked 7th best out of 172 countries for this measure. Australian females had a lower percentage (18%) but were ranked 19th best out of 172 countries.
Italy and Sweden had the lowest proportion (both 23%) of male deaths due to non-communicable diseases occurring under the age of 70. Females living in Italy and Spain experienced the fewest deaths from non-communicable diseases (both 13%).
Males in the United Arab Emirates experienced the highest proportion of deaths from non-communicable diseases before the age of 70 (85%); Sierra Leone had the highest proportion of non-communicable deaths for females (79%).
Figure 11.1: Percentage of deaths due to non-communicable diseases occurring under age 70 by sex, 2012
Source: WHO 2014. (Table S7, 524KB XLS).
Organisation for Economic Cooperation and Development (OECD)
OECD report on premature mortality using the measure of ‘potential years of life lost’ (PYLL) before the age of 70 years. Most OECD countries have high-income economies and, although each faces different challenges in dealing with specific mortality inequalities, are regarded as developed countries that provide a useful basis for comparison with Australia.
In 2011, Australia was ranked 10th out of 34 OECD countries for lowest premature mortality from all causes (2,764 PYLL per 100,000 population aged less than 70; Table 11.1). Iceland had the lowest rate (2,415 per 100,000) and Mexico had the highest rate (6,782 per 100,000).
Table 11.1: Potential years of life lost (PYLL per 100,000 population aged less than 70) due to all causes, top 10 OECD countries with lowest PYLL, 2011
| Rank | Country | All causes |
|---|---|---|
| 1 | Iceland  |
2,415.2 |
| 2 | Sweden  |
2,419.7 |
| 3 | Switzerland  |
2,482.5 |
| 4 | Italy  |
2,526.5 |
| 5 | Israel  |
2,576.7 |
| 6 | Luxembourg  |
2,639.2 |
| 7 | Spain  |
2,668.2 |
| 8 | Netherlands  |
2,687.0 |
| 9 | Norway  |
2,760.2 |
| 10 | Australia  |
2,763.7 |
Source: OECD 2015. (Table S8, 524KB XLS).
Figure 11.2 below shows Australia’s OECD ranking for premature mortality due to selected causes of death. The closer to the centre of the web, the worse the country’s ranking relative to other OECD countries. Australia was ranked in the top third of OECD countries for lowest premature mortality due to cerebrovascular disease (ranked 4th), lung cancer (7th), colorectal cancer (9th) and chronic liver disease (9th). For accidental poisoning, Australia was ranked 28th out of 34 countries, and for melanoma 33rd (only ahead of New Zealand).
Figure 11.2: Australia’s rank out of 34 OECD countries for premature mortality (lowest PYLL) due to selected causes of death, 2011
![]()
Source: OECD 2015. (Table S8, 524KB XLS).
Premature mortality in Canada and New Zealand
League tables are useful for broad comparisons but they do not shed light on differences between individual countries.
When looking at changes in premature mortality over time, it is helpful to compare Australia with similar countries.
Canada and New Zealand share many similarities with Australia in terms of population characteristics and health status. All 3 countries have heterogeneous populations spread across different geographic areas. Like Australia, Canada and New Zealand both experience inequalities across groups, including people of different cultural and linguistic backgrounds, people living in rural and remote areas and people from lower socioeconomic areas. Aboriginal populations in Canada (First Nations, Inuit and Metis) and Māori populations in New Zealand, like Indigenous populations in Australia (Aboriginal and Torres Strait Islanders), experience poorer health and mortality outcomes compared to the rest of the population. All 3 countries have universal health care arrangements but struggle with the burden of chronic diseases.
Between 1997 and 2011, the rate of premature mortality in Australia decreased by 25% (from 321 deaths per 100,000 population aged less than 75 to 241 per 100,000; Figure 11.3). Over the same time period, the premature mortality rate in Canada decreased by 15% (from 334 per 100,000 in 1997 to 286 per 100,000 in 2011).
Figure 11.3: Premature deaths (crude rate) by country and year, Australia, Canada and New Zealand, 1997–2012
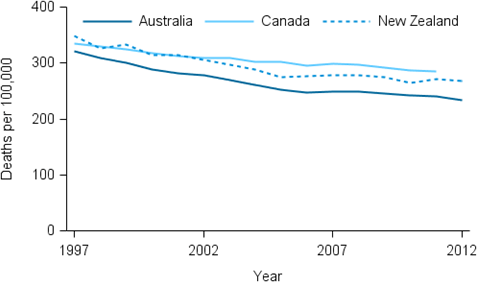
Note: Death rates have not been age-standardised and therefore do not take into account differences in age structure between countries and over time.
Sources: AIHW National Mortality Database; Statistics Canada 2015; Statistics New Zealand 2015. (Table S9, 524KB XLS).
Figure 11.4 shows the trend in PYLL over time in Australia, Canada and New Zealand. As with changes in death rates, the rate of PYLLs decreased by a greater margin in Australia (26%) compared with Canada (17%) and, to a lesser extent, New Zealand (25%). Australia’s rate of PYLLs was consistently lower than New Zealand during the 1997–2012 period but was higher than Canada until 2001 (50 PYLL per 1,000 population aged less than 75 in Australia and 51 PYLL per 1,000 in Canada).
Figure 11.4: Potential years of life lost (PYLL) by country and year, Australia, Canada and New Zealand, 1997–2012
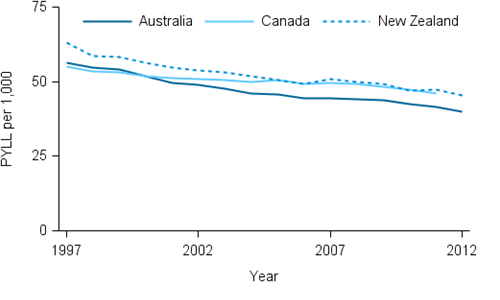
Sources: AIHW National Mortality Database; Statistics Canada 2015; Statistics New Zealand 2015. (Table S9, 524KB XLS).
Further information
AIHW 2012. A working guide to international comparisons of health. Cat. no. PHE 159. Canberra: AIHW.
OECD (Organisation of Economic Cooperation and Development) 2015. OECD Health Statistics 2014. Paris: OECD. Viewed 23 June 2015.
Statistics Canada 2015. CANSIM: Table 102-4312 Premature and potentially avoidable mortality . Ottawa: Statistics Canada. Viewed 23 June 2015.
Statistics New Zealand 2015. Infoshare: Deaths by age and sex (Annual-Dec) and Estimated Resident Population by age and sex (Annual-Jun). Wellington: Statistics New Zealand. Viewed 23 June 2015.
WHO (World Health Organisation) 2014. Global Health Observatory. Geneva: WHO. Viewed 22 May 2015.