Deaths among adults aged 65–74
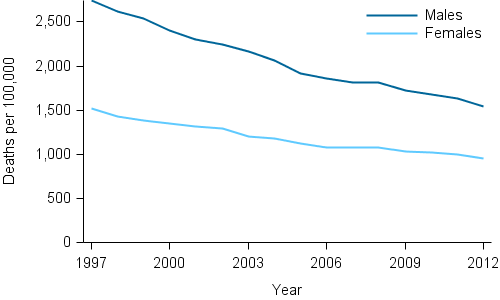
In 2012, there were 22,143 deaths among people aged 65–74 or 1,245 deaths per 100,000 population aged 65–74. The death rate decreased by 41% since 1997, from 2,101 deaths per 100,000 population to 1,245 deaths per 100,000 population in 2012 (Figure 9.1). Deaths due to coronary heart disease experienced substantial declines over this period of time, despite remaining the leading cause of death.
46% of deaths in this age group were considered potentially avoidable.
Figure 9.1: Death rates among adults aged 65–74, by sex, 1997–2012
Source: AIHW National Mortality Database (Table S1, 524KB XLS).
Coronary heart disease (12%) and lung cancer (11%) each accounted for about 1 in 10 deaths among people aged 65–74 in 2010–2012 (Table 9.1).
The mortality rate for coronary heart disease decreased by about two-thirds (66%) between 1997–1999 and 2010–2012 among 65–74 year olds.
Chronic obstructive pulmonary disease (COPD, 5.3%), cerebrovascular disease (4.6%) and colorectal cancer (4.4%) each accounted for about 1 in 20 deaths among this age group.
Among men aged 65–74, the leading causes of death were coronary heart disease (14%), lung cancer (11%) and COPD (4.8%).
Among women aged 65–74, the leading causes of death were lung cancer (11%), coronary heart disease (8.1%) and breast cancer (7.2%).
| Rank | Cause of death | Deaths | Per cent |
|---|---|---|---|
| 1 | Coronary heart disease (chronic) see fact sheet and GRIM book. |
7,755 |  11.8 |
| 2 | Lung cancer (cancer) see fact sheet and GRIM book. |
7,353 |  11.2 |
| 3 | COPD (chronic) see fact sheetand GRIM book. |
3,479 |  5.3 |
| 4 | Cerebrovascular disease (chronic) see fact sheet and GRIM book. |
3,060 |  4.6 |
| 5 | Colorectal cancer (cancer) see fact sheet and GRIM book. |
2,900 |  4.4 |
Notes
- Colours indicate broad cause of death category.
blue = chronic disease, orange = cancer, purple = injury & poisoning, green = other cause of death. - Injury and poisoning death data should be interpreted with caution due to the potential for revision (see Source data).
Source: AIHW National Mortality Database (Table S2, 524KB XLS).