Trends in premature mortality
There were 6,411 fewer premature deaths in 2012 compared with 1997; this equates to a 35% decrease in the age-standardised mortality rate (327 deaths per 100,000 population aged less than 75 in 1997 to 212 per 100,000 in 2012; Figure 2.1).
Some of the major declines in premature mortality have been from causes such as land transport accidents, cerebrovascular disease and colorectal cancer.
Deaths among people aged less than 75 accounted for 43% of all deaths in 1997 compared with 34% of all deaths in 2012.
Figure 2.1: Age-standardised death rates among people aged less than 75, by sex, 1997–2012
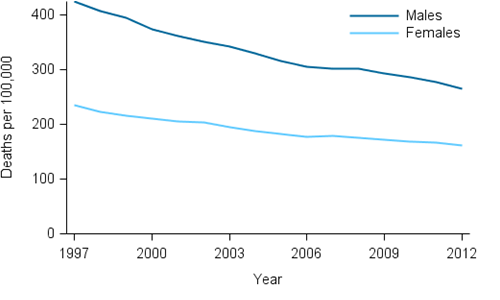
Source: AIHW National Mortality Database (Table S1, 524KB XLS).
The rate of PYLLs decreased by 29% from 56 PYLLs per 1,000 population aged less than 75 in 1997 to 40 per 1,000 in 2012.
In 1997, 59% of premature deaths were considered potentially avoidable compared with 50% in 2012.
The age-standardised rate of potentially avoidable deaths decreased by 44% from 193 deaths per 100,000 in 1997 to 108 per 100,000 in 2012.