Diagnostic imaging services
Steady growth in use of diagnostic imaging services over the last 6 years
Almost 2 in 5 Australians (39%, or 9.6 million people) had a diagnostic imaging service in 2018–19. Between 2013–14 and 2018–19, there was a relative increase in the percentage of the population who had a diagnostic imaging service (4.3%), in the number of attendances per 100 people (12.8%), and in the Medicare benefits paid (21.1%) (Table 3).
|
Measure |
2013–14 |
2018–19 |
Relative change in rate since 2013–14(a) |
|---|---|---|---|
|
Percentage of people(b) who had a diagnostic imaging service |
37% |
39% |
4.3% ▲ |
|
Number of diagnostic imaging services per 100 people(b) |
91 per 100 people |
103 per 100 people |
12.8% ▲ |
|
Total Medicare benefits paid for diagnostic imaging services per 100 people(b)(c) |
$11,795 per 100 people |
$14,285 per 100 people |
21.1% ▲ |
Notes:
(a) Discrepancies may be due to rounding of numbers.
(b) The numerator is the number of people who had a diagnostic imaging service and the denominator is the ABS ERP.
(c) Expenditure results are not adjusted for inflation.
Sources: AIHW analysis of Department of Health, MBS claims data; ABS ERP.
Use of diagnostic imaging services varies across PHN areas
Across PHN areas, the Nepean Blue Mountains PHN area consistently had the highest percentage of people who had a diagnostic imaging service, while the Northern Territory PHN area had the lowest percentage between 2013–14 and 2018–19 (Figure 5). In 2018–19, 45% of people in the Nepean Blue Mountains PHN area had a diagnostic imaging service compared with 26% of people in the Northern Territory PHN area (see Interpreting the data for more details).
Between 2013–14 and 2018–19, the Perth South PHN area had the highest percentage point increase in the proportion of people who had a diagnostic imaging service, from 30% to 36%. This was followed by the Western Queensland PHN (from 28% to 32%), the Perth North PHN (from 31% to 35%) and the Country WA PHN areas (from 29% to 32%). The Central and Eastern Sydney PHN area had a slight decrease in the percentage of people who had a diagnostic imaging service, from 37% in 2013–14 to 36% in 2018–19.
Figure 5: Percentage of people who had a Medicare-subsidised diagnostic imaging service, by PHN area, 2013–14 and 2018–19
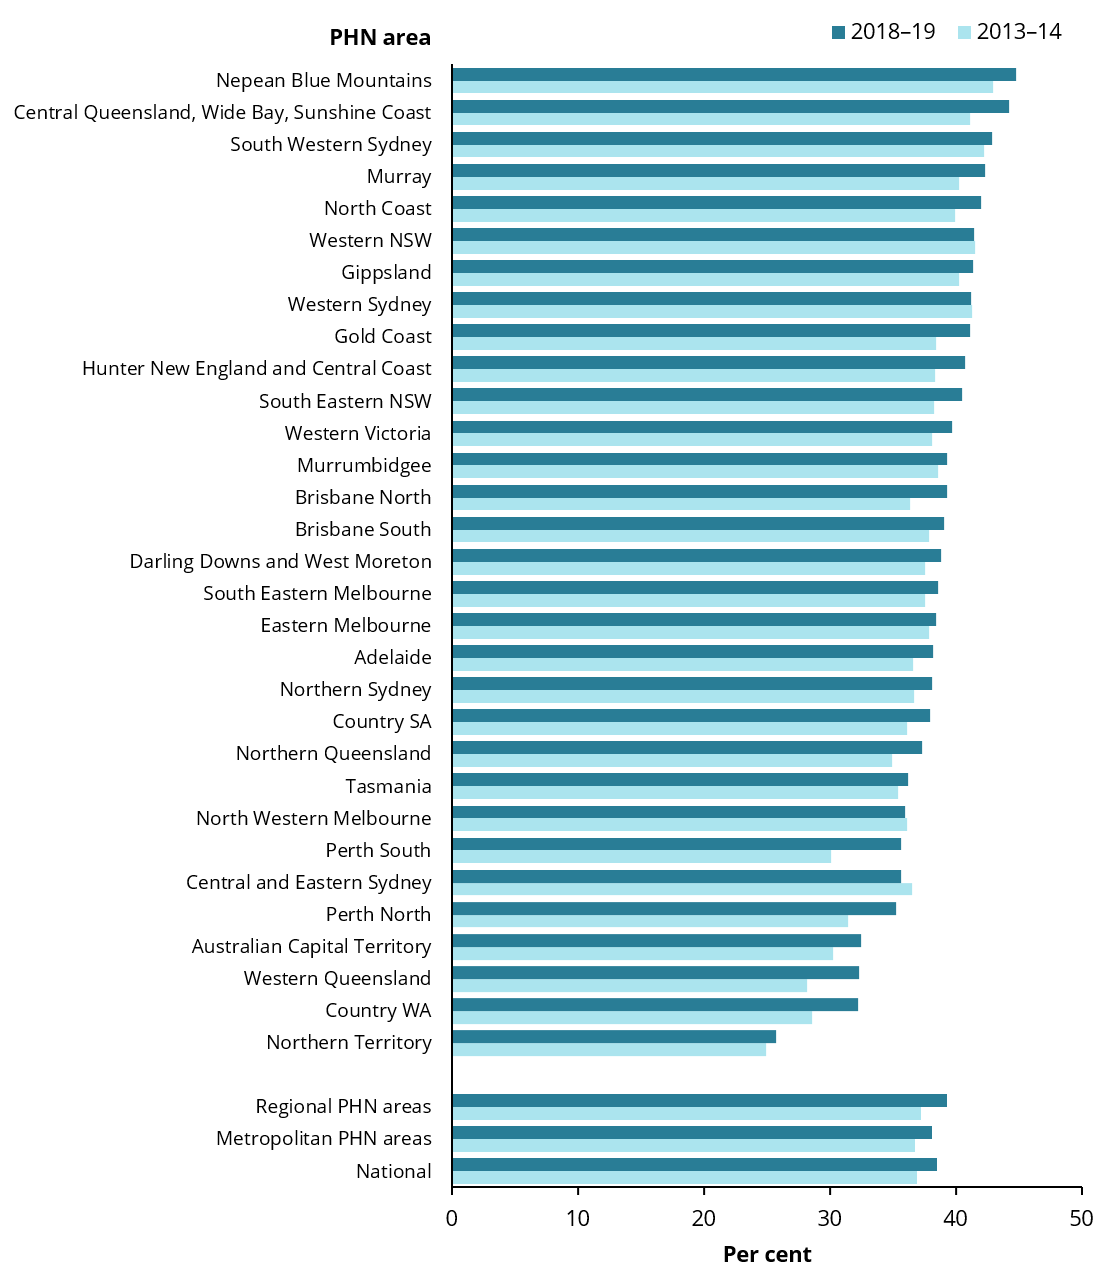
Chart: AIHW. Sources: AIHW analysis of Department of Health, Medicare Benefits claims data; ABS ERP.