After-hours GP attendances
Changes over time in the use of after-hours GP visits
In 2018–19, 23% of Australians had an after-hours GP visit. While there was a steady increase in the proportion of people using after-hours GP services from 20% in 2013–14 to 24% in 2017–18, there was a slight decrease between 2017–18 (24%) and 2018–19 (23%).
Visits to after-hours GP services were higher in metropolitan areas and varied considerably across PHNs
People in regional PHN areas were less likely to visit a GP after-hours (15%) than people in metropolitan PHN areas (28%) in 2018–19 (Figure 3). This pattern remains unchanged since 2013–14, with 13% of people in regional PHN areas visiting a GP after-hours, compared with 24% of people in metropolitan PHN areas.
Across PHN areas, after-hours GP visits ranged from 9.5% of people living in North Coast (NSW) to 37% of people in Western Sydney in 2018–19. However, the Perth South PHN area had the highest percentage point change in the proportion of people who had an after-hours GP visit, with an increase from 15% in 2013–14 to 25% in 2018–19.
Figure 3: Percentage of people who had a Medicare-subsidised after-hours GP attendance, by PHN area, 2013–14 and 2018–19
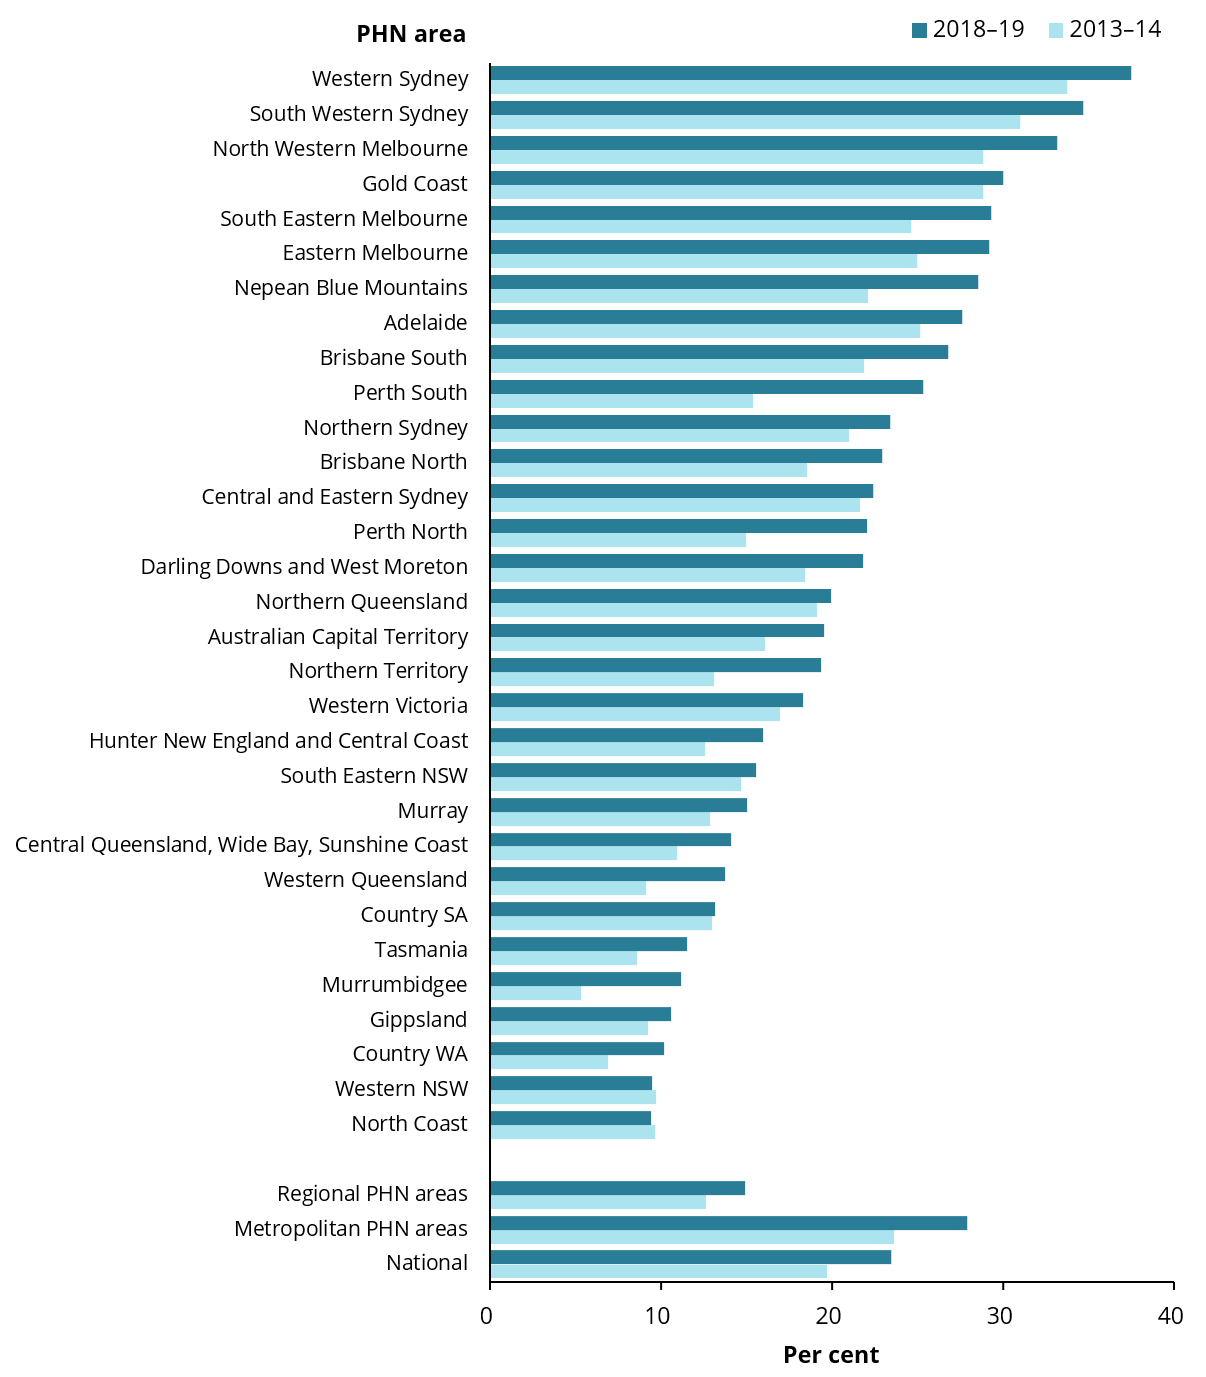
Chart: AIHW. Sources: AIHW analysis of Department of Health, MBS claims data; ABS ERP.
Box 4: After-hours GP visits
The Australian Government provides a range of Medicare-subsidised after-hours services to support Australians with access to health care in various settings including consulting rooms, consumers’ homes or residential aged care facilities. After-hours care is categorised as urgent and non-urgent, depending on when and where care is provided.
In this report, urgent and non-urgent after-hours care are defined as per the Medicare Benefits Schedule. For more details, see Technical Information.
After-hours GP visits in Major cities were highest in lower socioeconomic areas
The percentage of people who had an after-hours GP visit in Major cities was consistently higher in lower socioeconomic SA3 areas, than in medium and higher socioeconomic areas across all 6 years. In 2018–19, 33% of people in lower socioeconomic SA3 areas had an after-hours GP visit compared with 27% in medium and 21% in higher socioeconomic SA3 areas.
Only 1 in 10 after-hours GP visits was urgent in 2018–19
GP after-hours visits billed as urgent accounted for 13% of all GP after-hours visits in 2013–14, rising to 16% in 2015–16 but decreasing to 10% in 2018–19 (Figure 4).
Figure 4: Proportion of Medicare-subsidised urgent and non-urgent after-hours GP visits, 2013–14 to 2018–19
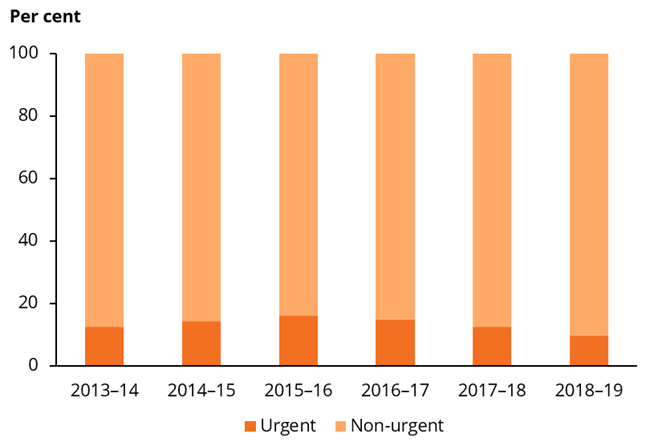
Chart: AIHW. Sources: AIHW analysis of Department of Health, MBS claims data; ABS ERP.
Use of urgent after-hours GP services varied across the country. In 2018–19, the rate of urgent after-hours GP services ranged from 0.5 visits per 100 people in the Northern Territory PHN area to 12 visits per 100 people in the Gold Coast PHN area. People living in the Gold Coast PHN area consistently had the highest rate of urgent after-hours GP service use across all 6 years—from 19 visits per 100 people in 2013–14, increasing to 22 per 100 people in 2015–16, and decreasing to 12 per 100 people in 2018–19.
Box 5: GP telehealth services
In 2018–19, the Australian Government introduced a range of Medicare-subsidised GP telehealth services, providing general consultation services by video conference to people living in flood-affected areas in Queensland, and mental health and well-being support to people living in drought-affected communities. These Medicare-subsidised services are not reported separately in this publication due to small numbers at local areas. These telehealth items are included in this publication in the following GP service groups: Short, Long, Standard, Prolonged, Mental Health and Focussed Psychological Strategies and Family Group Therapy. Note, in response to the COVID-19 pandemic, the Australian Government further expanded these Medicare-subsidised GP telehealth services from March 2020. The findings in this report precede the introduction of these new GP telehealth services. For further detail, see Technical Information.
For more information on Medicare-subsidised services, see the following AIHW reports on:
- Mental health services: Mental health services in Australia
- Indigenous services: Indigenous health checks and follow-ups
- Residential aged care services: Interfaces between the aged care and health systems in Australia—GP use by people living in permanent residential aged care 2012–13 to 2016–17 and GEN Aged Care Data
For local area data on after-hours emergency department presentations for lower urgency care, see AIHW’s Use of emergency departments for lower urgency care: 2015–16 to 2018–19.