Specialist attendances
1 in 3 people had a non-hospital specialist attendance
Around 1 in 3 Australians (31%, or 7.8 million people) had a non-hospital specialist attendance in 2018–19. Between 2013–14 and 2018–19, there was a relative increase in the percentage of the population who had a specialist attendance (5.1%), in the number of attendances per 100 people (6.2%), and in the Medicare benefits paid (12%) (Table 5).
|
Measure |
2013–14 |
2018–19 |
Relative change in rate since 2013–14(a) |
|---|---|---|---|
|
Percentage of people(b) who had a specialist attendance |
30% |
31% |
5.1% ▲ |
|
Number of specialist attendances per 100 people(b) |
90 per 100 people |
95 per 100 people |
6.2% ▲ |
|
Total Medicare benefits paid for specialist attendances per 100 people(b)(c) |
$7,382 per 100 people |
$8,284 per 100 people |
12.2% ▲ |
Notes:
(a) Discrepancies may be due to rounding of numbers.
(b) The numerator is the number of people who had a specialist attendance and the denominator is the ABS ERP.
(c) Expenditure results are not adjusted for inflation.
Sources: AIHW analysis of Department of Health, MBS claims data; ABS ERP.
Specialist attendances outside of hospital continue to vary depending on where people live
There was considerable variation across the country each year—between 2013–14 and 2018–19, the Northern Sydney PHN area consistently had the highest rate of specialist attendances (36% in 2013–14 and 38% in 2018–19), while the Northern Territory PHN area had the lowest rate (14% in 2013–14 and in 2018–19) (Figure 9). This variation may be due to a range of factors, see Interpreting the data for more details.
Figure 9: Percentage of people who had a Medicare-subsidised specialist attendance, by PHN area, 2013–14 and 2018–19
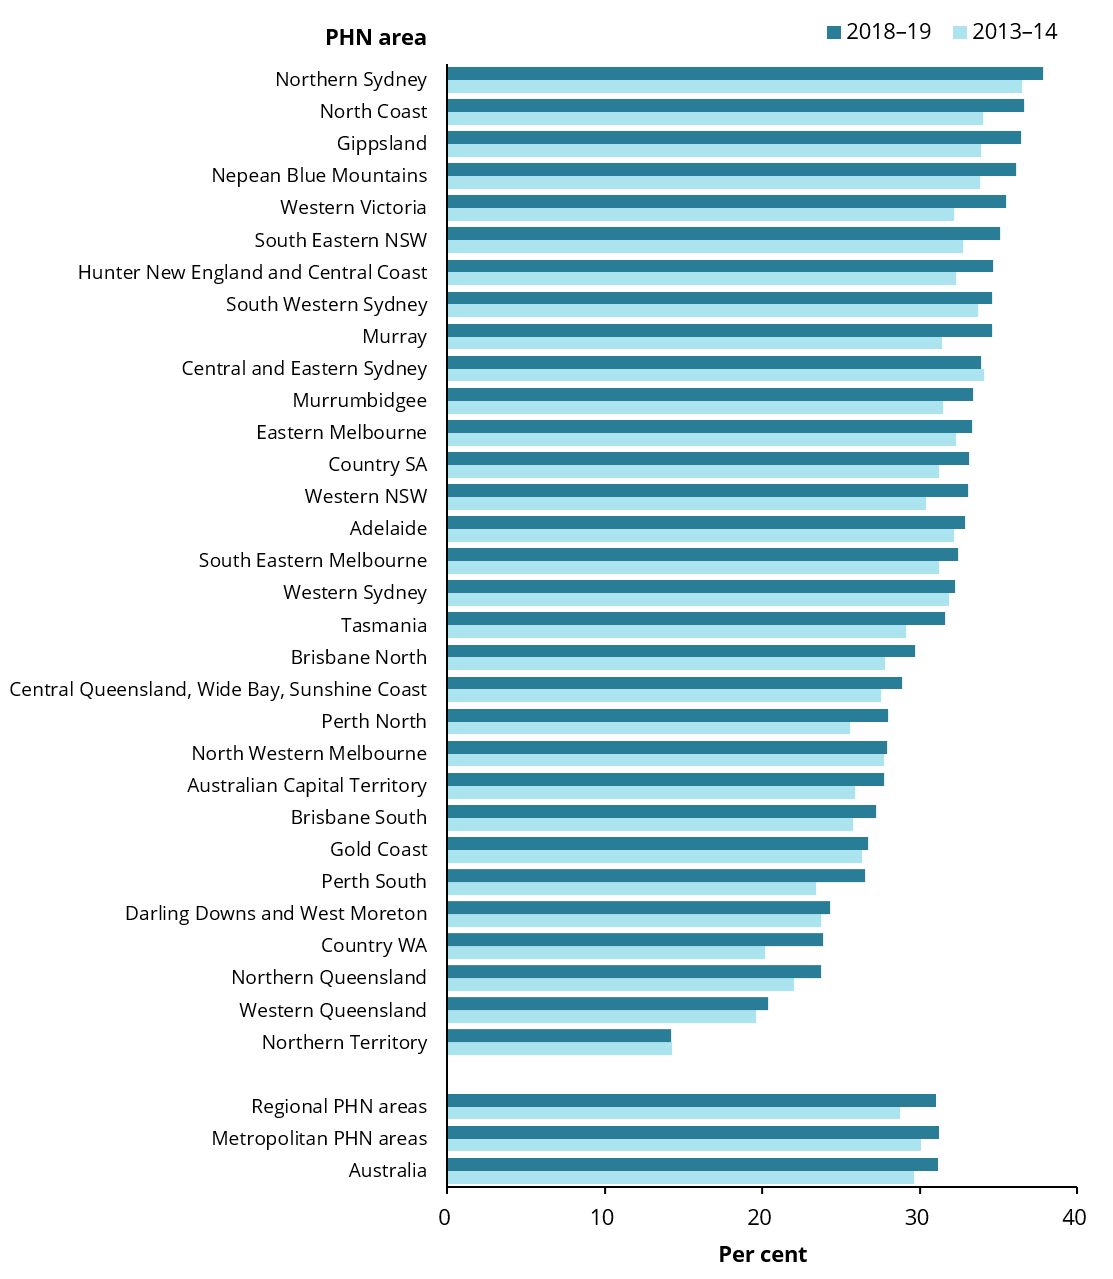
Chart: AIHW. Sources: AIHW analysis of Department of Health, MBS claims data; ABS ERP.
Higher growth in use of specialist attendances in regional PHN areas than metropolitan PHN areas
Across the 6 years, almost all PHN areas experienced an increase in the percentage of people who had a specialist attendance. During this time, regional PHN areas experienced a slightly higher increase in the percentage of people who had a specialist attendance (from 29% in 2013–14 to 31% in 2018–19) compared with metropolitan PHN areas (from 30% in 2013–14 to 31% in 2018–19). The largest increase in percentage points was seen in the Country WA PHN area (from 20% in 2013–14 to 24% in 2018–19), followed by the Western Victoria PHN area (from 32% to 35%).