Enhanced Primary Care GP attendances
Almost 1 in 4 people had an Enhanced Primary Care GP visit
People living with complex health conditions, including chronic or terminal medical conditions may receive Medicare-subsidised chronic disease management services from their GP for the diagnosis, treatment, planning, review and coordination of their care.
An increasing percentage of people had a GP Enhanced Primary Care service in 2018–19, 24% (5.9 million people), up from 18% (4.2 million people) in 2013–14. This change may be attributed to the steady growth in the percentage of people who had Chronic Disease Management Plans and mental health services between 2013–14 and 2018–19 (Table 2).
Box 1: GP Enhanced Primary Care
In this report, GP Enhanced Primary Care refers to a range of services such as health assessments, medication management reviews, the creation and review of treatment plans, and coordination of care for people living with complex health conditions who require multidisciplinary, team-based care from a GP and at least two other providers. For more information, see Technical Information.
| Enhanced Primary Care services(b)(c) | 2013–14 (%) | 2018–19 (%) | Percentage point change(d) |
|---|---|---|---|
|
Chronic Disease Management Plan |
10 |
15 |
4.6 ▲ |
| Mental Health |
6.6 |
8.8 |
2.2 ▲ |
| Health Assessments |
4.0 |
4.2 |
0.2 ▲ |
| Multidisciplinary Case Conference |
0.1 |
0.2 |
0.1 ▲ |
| Medication Management Review (domiciliary) |
0.40 |
0.29 |
−0.11 ▼ |
| Medication Management Review (residential) |
0.30 |
0.29 |
−0.01 ▼ |
| Total Enhanced Primary Care(c) |
18 |
24 |
5.5 ▲ |
Notes:
(a) In this report, GP Enhanced Primary Care refers to a range of non-hospital Medicare-subsidised services such as health assessments, medication management reviews, the creation and review of treatment plans, and coordination for people living with complex health conditions who require multidisciplinary, team-based care from a GP and at least two other providers.
(b) Refer to Technical Information for details on MBS items and description of service groups.
(c) People may receive services from more than one subgroup within GP Enhanced Primary Care, but are only counted once in the total.
(d) Discrepancies may be due to rounding of numbers.
Sources: AIHW analysis of Department of Health, MBS claims data; ABS ERP.
Higher growth in GP Enhanced Primary Care service use in regional PHN areas
The percentage of people receiving Enhanced Primary Care services rose steadily in almost every PHN area since 2013–14. A higher percentage of people living in regional PHN areas (26%) had a GP Enhanced Primary Care service than people living in metropolitan PHN areas (22%) in 2018–19. This pattern remains unchanged since 2013–14—20% of people living in regional PHN areas had a GP Enhanced Primary Care service compared with 17% of people living in metropolitan PHN areas (Figure 2). The most noticeable change was in the Western Queensland regional PHN area where GP Enhanced Primary Care service use grew from 14% of people in 2013–14 to 24% in 2018–19.
Box 2: PHN and Statistical Area Level 3 (SA3) geographical groupings
To support comparisons between similar geographical areas, PHNs are grouped into metropolitan and regional PHN areas. Results for SA3s are grouped by similar socioeconomic status (higher, medium and lower) for SA3s in Major cities, and by remoteness areas for SA3s in Inner Regional, Outer regional and Remote areas. For more information, see Technical Note – Geography.
Figure 2: Percentage of people who had a Medicare-subsidised GP Enhanced Primary Care service, by PHN groups, 2013−14 to 2018−19
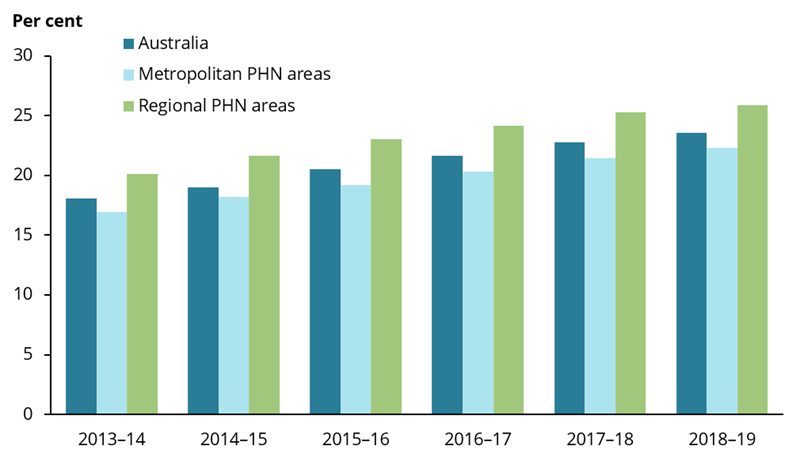
Chart: AIHW. Sources: AIHW analysis of Department of Health, MBS claims data; ABS ERP.
Use of Residential and Home Medication Management Reviews remains low
In 2018–19, people aged 80 and over were the most common recipients of Residential and Home Medication Management Reviews, accounting for more than half (54%) of the services claimed.
The proportion of people aged 80 and over receiving these Medication Management Reviews declined slightly between 2013–14 and 2018–19:
- Residential Medication Management Reviews decreased from 5.9% to 5.4%
- Home Medication Management Reviews decreased from 3.3% to 2.5%.
Box 3: Residential and Home Medication Management Reviews
Residential and Home Medication Management Reviews are provided by GPs and are designed to enhance the quality use of medicines by helping people and their carers to better manage their medicines. Residential Medication Management Reviews are only available to people living in residential aged care facilities (also known as nursing homes). Quality use of medicines refers to the appropriateness to use a medicine, identifying which is the most appropriate medicine and monitoring safety and effectiveness of the medicine to ensure that the best possible results are achieved for the patient (Department of Health 2016a). For more details on Residential and Home Medication Management Reviews, see Technical Information.
References
Department of Health 2016a. Quality Use of Medicines. Canberra: Department of Health. Viewed 14 July 2020.