QIM 10: Proportion of regular clients with diabetes with blood pressure recorded in their GP record within the previous 6 months
On this page:
Overview
Regional proportions
National proportions over time
National proportions by age and sex
Overview
Cardiovascular disease (CVD) is the leading cause of death in people with diabetes, making regular assessment, prevention, and management of CVD risk factors such as blood pressure and lipid levels, a vital part of diabetes care. For people with Type 1 or Type 2 diabetes, managing blood pressure can help ensure appropriate medical care to lower the risk of macrovascular (stroke, heart attack and heart failure) and microvascular (kidney disease, eye disease and peripheral neuropathy) complications (RACGP 2020d).
Capture of results recorded outside of the general practice setting
Some patients with diabetes may receive care from other practitioners in addition to a GP, including an endocrinologist/a specialist physician, and/or other health care providers to safely manage their diabetes (RACGP 2020d). Results arising from clinical intervention conducted outside of the service that are known and recorded by the practice are included in the measure. However, sometimes blood pressure recorded elsewhere is not captured in this report. For example, this might be a result from a specialist service that is not recorded in the clinical information system (CISs) of the client’s usual general practice due to an incompatible CISs between a practice and a specialist service.
Other sources of relevant data
Data on prevalence of long-term health conditions like diabetes are captured in the National Health Survey (NHS) conducted by the Australian Bureau of Statistics (ABS). There are other administrative data collections where the data from these client-provider interactions are captured, for example, Medicare Benefits Schedule (MBS), the National Diabetes Service Scheme (NDSS) register, the Australasian Paediatric Endocrine Groups (APEG), and state and territory registers.
This indicator reports on the proportion of regular clients who have Type 1 or Type 2 diabetes, or an undefined diabetes diagnosis, hereafter described as diabetes, who had blood pressure recorded in their GP record within the previous 6 months.
The QIM proportions summarised by the different extraction tools in use are also shown in the ‘Regional proportions’ bar charts for this measure. This illustrates the differences in how software providers have interpreted the technical specifications and coding of QIMs.
QIM 10: Regional proportions
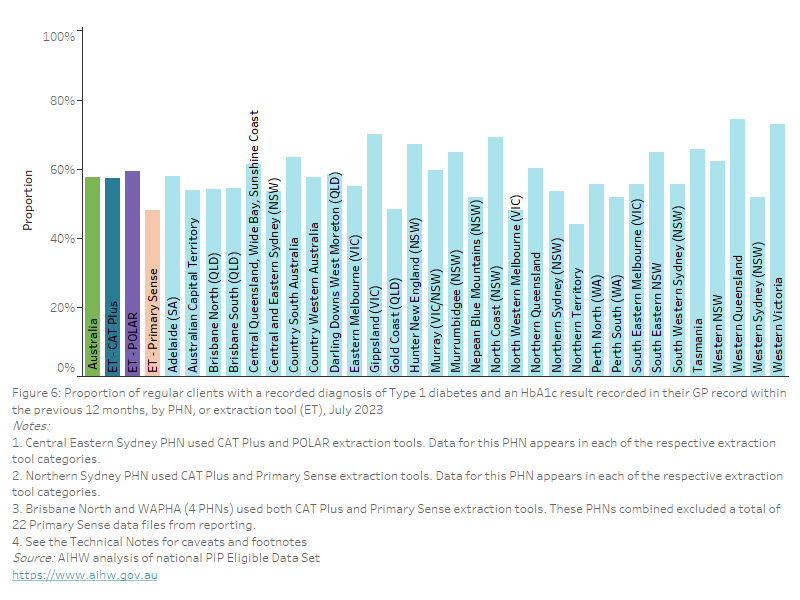
As of July 2023, nationally, 56.9% of regular clients with diabetes had blood pressure recorded in their GP record within the previous 6 months. This varied from 46.5% to 71.0% across PHNs, and between 55.9% and 58.4% across extraction tools.
Figure 53: Proportion of regular clients with diabetes (Type 1, Type 2, undefined) and blood pressure recorded in their GP record within the previous 6 months, by PHN, or extraction tool (ET), July 2023
This bar chart shows the proportion of regular clients with diabetes (Type 1, Type 2 and undefined) and blood pressure recorded in their GP record, by PHN and extraction tool, for July 2023.
QIM 10: National proportions over time
Nationally, between January 2023 and July 2023, the proportion of regular clients with diabetes who had blood pressure recorded in their GP record within the previous 6 months remained constant at 55.4% and 56.9%, respectively.
Figure 54: Proportion of regular clients with diabetes (Type 1, Type 2, undefined) and blood pressure recorded in their GP record within the previous 6 months, January 2023 to July 2023
This line chart shows the proportion of regular clients with diabetes (Type 1, Type 2 and undefined) and blood pressure recorded in their GP record, from January 2023 to July 2023
%3dQIM10+-+RECORDED&embed_code_version=3&tabs=no&toolbar=no&showAppBanner=false)
QIM 10: National proportions by age and sex
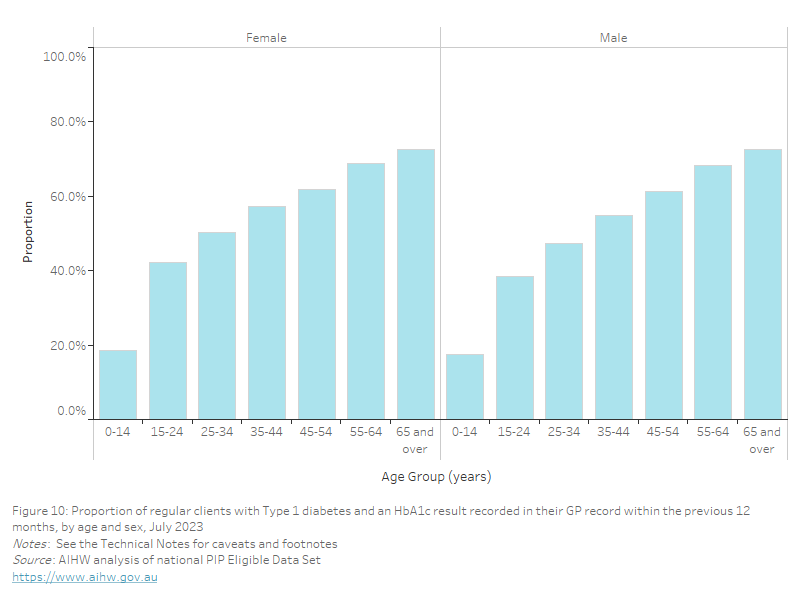
As of July 2023, nationally, the proportion of regular clients with diabetes who had blood pressure recorded in their GP record within the previous 6 months increased with age and was:
- highest in the 65 years and over age group for both females (62.5%) and males (62.8%)
- lowest in the 0–14 years age group for females (7.3%) and males (6.3%).
Figure 55: Proportion of regular clients with diabetes (Type 1, Type 2, undefined) and blood pressure recorded in their GP record within the previous 6 months, by age and sex, July 2023
This bar chart shows the proportion of regular clients with diabetes (Type 1, Type 2 and undefined) and blood pressure recorded in their GP record, by age and sex for July 2023
- Clinical definitions for diabetes vary across CISs, as different coding schemes are used. This may lead to some variation in the number of clients who will be picked up by different systems (AIHW 2023f).
- Results arising from measurements conducted outside of the service that are known and recorded by the service are included in the measure.
- A client is classified as having Type 1 or Type 2 diabetes, or a diagnosis which indicates diabetes but does not specify between Type 1 or Type 2, listed as a diagnosis in their GP record. If a client had gestational diabetes but also has Type 1 or Type 2 diabetes, they are included in the measure.
- Clients are excluded from the measure if they had:
- secondary diabetes, gestational diabetes mellitus (GDM), previous GDM, impaired fasting glucose, impaired glucose tolerance,
- results from measurements conducted outside of the service that were not available to the service; and had not visited the service in the previous 6 months.
- There are other administrative data collections where the data from these client-provider interactions are captured, for example, Medicare Benefits Schedule (MBS), the National Diabetes Service Scheme (NDSS) register, the Australasian Paediatric Endocrine Groups (APEG) state and territory registers.
AIHW (Australian Institute of Health and Welfare) (2023f) First Nations-specific primary health care: results from the nKPI and OSR collections, AIHW, Canberra, accessed 03 August 2023.
RACGP (The Royal Australian College of General Practitioners) (2020d) Management of type 2 diabetes: A handbook for general practice, RACGP, East Melbourne, Victoria, accessed 2 August 2023.