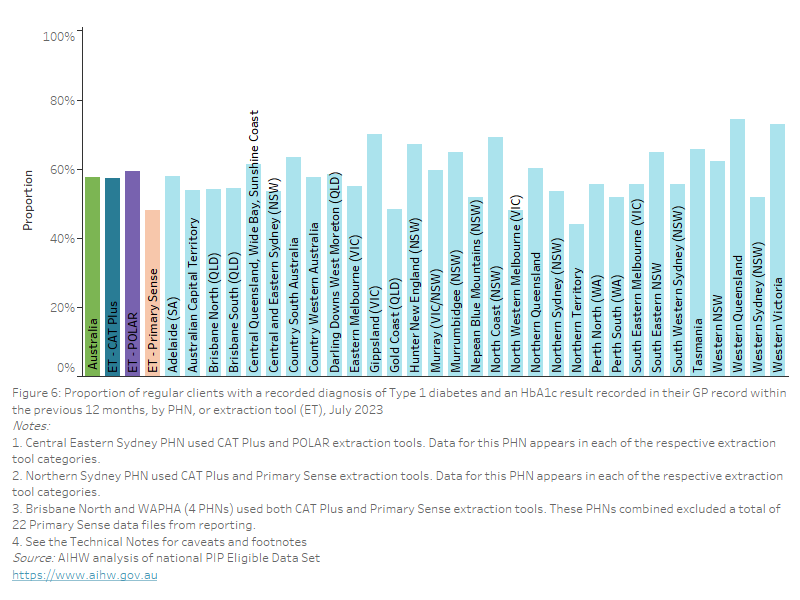
This bar chart shows the proportion of regular clients aged 15 years and over who had their height and weight measurement recorded in their GP record within the previous 12 months, by PHN and extraction tool, for July 2023.

This line chart shows the proportion of regular clients aged 15 years and over who had their height and weight recorded in their GP record within the previous 12 months, from January 2023 to July 2023
%3dQIM3+-+RECORDED&embed_code_version=3&tabs=no&toolbar=no&showAppBanner=false)
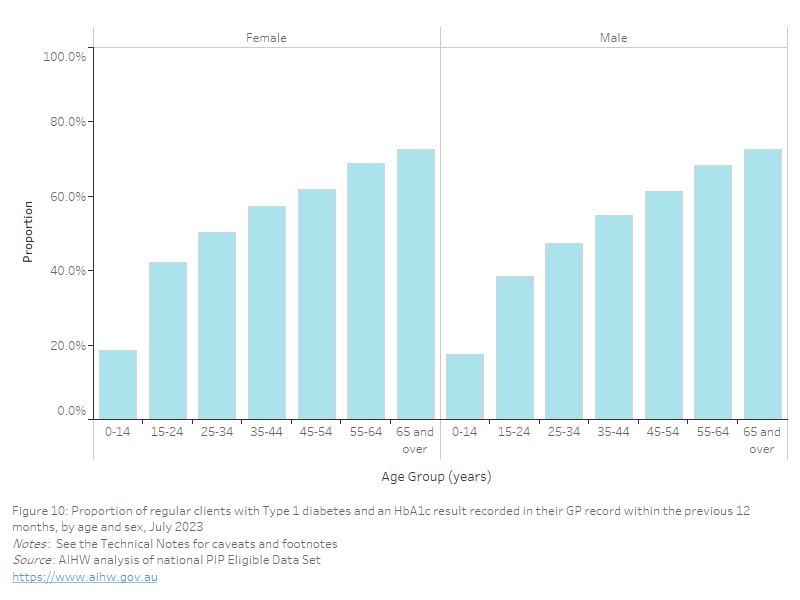
This bar chart shows the proportion of regular clients aged 15 years and over who had their height and weight recorded in their GP record within the previous 12 months, by age and sex for July 2023.

This bar chart shows the proportion of regular clients aged 15 years and over who had their height and weight recorded and their BMI classified as “underweight” in their GP record within the previous 12 months, by PHN and extraction tool, for July 2023.

This bar chart shows the proportion of regular clients aged 15 years and over who had their height and weight recorded and their BMI classified as “healthy” in their GP record within the previous 12 months, by PHN and extraction tool, for July 2023.

This bar chart shows the proportion of regular clients aged 15 years and over who had their height and weight recorded and their BMI classified as “overweight” in their GP record within the previous 12 months, by PHN and extraction tool, for July 2023.

This bar chart shows the proportion of regular clients aged 15 years and over who had their height and weight recorded and their BMI classified as “obese” in their GP record within the previous 12 months, by PHN and extraction tool, for July 2023.
This line chart shows the proportion of regular clients aged 15 years and over who had their height and weight recorded in their GP record within the previous 12 months, by BMI classification, from January 2023 to July 2023
%3dQIM3+-+BMI&embed_code_version=3&tabs=no&toolbar=no&showAppBanner=false)
This bar chart shows the proportion of regular clients aged 15 years and over who had their height and weight recorded and their BMI classified as “underweight” in their GP record within the previous 12 months, by age and sex for July 2023

This bar chart shows the proportion of regular clients aged 15 years and over who had their height and weight recorded and their BMI classified as “healthy” in their GP record within the previous 12 months, by age and sex for July 2023

This bar chart shows the proportion of regular clients aged 15 years and over who had their height and weight recorded and their BMI classified as “overweight” in their GP record within the previous 12 months, by age and sex for July 2023
This bar chart shows the proportion of regular clients aged 15 years and over who had their height and weight recorded and their BMI classified as “obese” in their GP record within the previous 12 months, by age and sex for July 2023
