QIM 7: Proportion of regular clients with an alcohol consumption status recorded in their GP record
On this page:
Overview
Regional proportions
National proportions over time
National proportions by age and sex
Overview
In 2020-21, one in 4 (25.8%) people aged 18 years and over consumed more than 2 standard drinks per day on average, exceeding the lifetime risk guideline (ABS 2021c). Men were more likely to exceed the guideline than women (33.6% compared to 18.5%) (ABS 2021c). Excessive consumption of alcohol is associated with health and social problems in all populations. It was the fifth-highest risk factor contributing to the total burden of disease and injury (4.5% contribution) based on estimates from the Australian Burden of Disease Study (AIHW 2019b). For adolescents and young adults, non-fatal burden was the main contributor to alcohol-attributed burden, while for those aged 55 and over fatal burden was the main contributor. The burden from alcohol disorders was higher in males (2.0%) than females, ranking 13th in total male burden and outside the top 20 for females. Alcohol use was the leading risk factor contributing to disease burden for males aged 15–24 (13%) and 25–44 (12%) (AIHW 2019b).
Alcohol-induced deaths are defined as those that can be directly attributed to alcohol use (i.e. where an alcohol-related condition is recorded as the underlying cause of death), as determined by toxicology and pathology reports. The number of alcohol-induced deaths continues to rise, with 1,559 deaths reported in 2021, a 7.4% increase from 1,457 alcohol-induced deaths in 2020 which was an increase from 5.2 per 100,000 population in 2020 to 5.4 per 100,000 population in 2021. Alcohol-related deaths include deaths directly attributable to alcohol use (as defined above) and deaths where alcohol was listed as an associated cause of death (e.g. a motor vehicle accident where a person recorded a high blood alcohol concentration). There were 4,616 alcohol-related deaths in 2021. This has increased from 2,823 alcohol-related deaths in 2012, an increase from 11.6 per 100,000 population to 16.5 per 100,000 (AIHW 2023d).
Capture of results recorded outside of the general practice setting
Results arising from clinical intervention conducted outside of the service that are known and recorded by the practice are included in the measure. Where alcohol consumption was recorded elsewhere but is not known to the practice, this is not captured in the report. For example, this might be where the rehabilitation centre’s information systems may not be compatible with the clinical information system (CISs) of the client’s usual general practice.
Other sources of relevant data
Data on prevalence of health risk factors such as alcohol consumption status of Australians are captured in the National Health Survey (NHS) conducted by the Australian Bureau of Statistics (ABS) and the National Drug Strategy Household Survey (NDSHS). There are other administrative data collections where the relevant data from these client-provider interactions are captured, for example, smoking and drug rehabilitation services, and community health centres.
This indicator measures the proportion of regular clients aged 15 years and over who had an alcohol consumption status recorded in their GP record.
The QIM proportions summarised by the different extraction tools in use are also shown in the ‘Regional proportions’ bar charts for this measure. This illustrates the differences in how software providers have interpreted the technical specifications and coding of QIMs.
QIM 7: Regional proportions
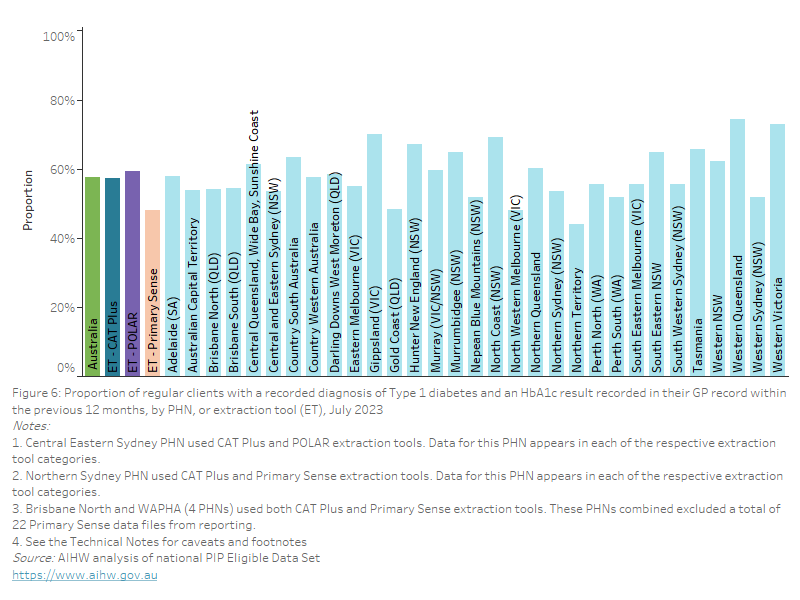
As of July 2023, nationally, 59.4% of regular clients aged 15 years and over had their alcohol consumption status recorded in their GP record. This varied from 48.7% to 82.5% across PHNs, and between 53.8% and 81.6% across extraction tools.
Figure 44: Proportion of regular clients aged 15 years and over with a record of alcohol consumption status in their GP record, by PHN, or extraction tool (ET), July 2023
This bar chart shows the proportion of regular clients aged 15 years and over with an alcohol consumption status recorded in their GP record, by PHN and extraction tool, for July 2023.
QIM 7: National proportions over time
Nationally, between January 2023 and July 2023, the proportion of regular clients aged 15 years and over who had an alcohol consumption status recorded in their GP record remained constant at 58.6% and 59.4%, respectively.
Figure 45: Proportion of regular clients aged 15 years and over with a record of alcohol consumption status in their GP record, January 2023 to July 2023
This line chart shows the proportion of regular clients aged 15 years and over with an alcohol consumption status recorded in their GP record, from January 2023 to July 2023
%3dQIM7+-+RECORDED&embed_code_version=3&tabs=no&toolbar=no&showAppBanner=false)
QIM 7: National proportions by age and sex
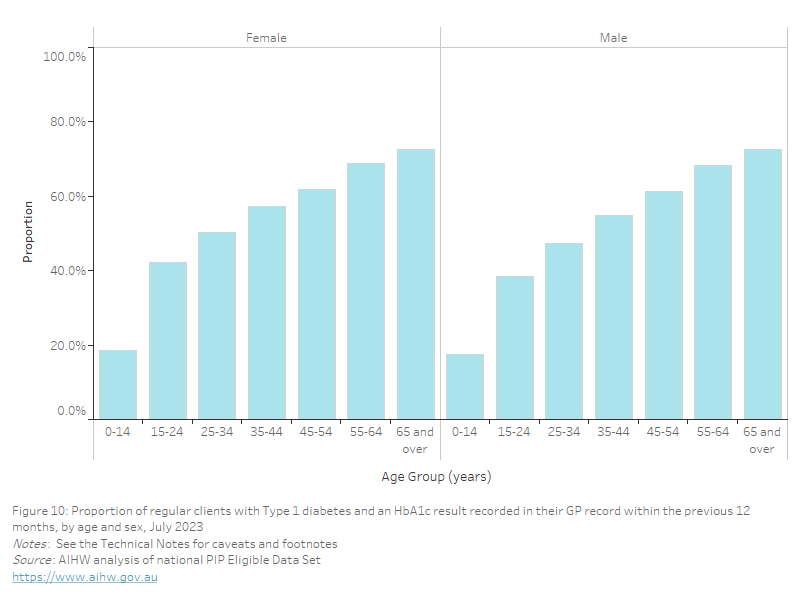
As of July 2023, nationally, the proportion of regular clients with their alcohol consumption status recorded in their GP record was:
- highest in the 65 years and over age group for both females (63.5%) and males (65.3%)
- lowest in the 15–24 years age group for both females (45.8%) and males (41.3%).
Figure 46: Proportion of regular clients aged 15 years and over with a record of alcohol consumption status in their GP record, by age and sex, July 2023
This bar chart shows the proportion of regular clients aged 15 years and over with an alcohol consumption status recorded in their GP record, by age and sex for July 2023
- Includes in the numerator only those clients aged 15 years and over with an alcohol consumption status ever recorded in their GP record. There is currently no reference period of recording the client status applied for this QIM within the technical specification documents.
- Data on alcohol consumption results (frequency and dose) are not captured in this measure.
ABS (Australian Bureau of Statistics) (2021c) Alcohol consumption, ABS, Canberra, accessed 11 July 2023.
AIHW (Australian Institute of Health and Welfare) (2019b) Australian Burden of Disease Study: impact and causes of illness and death in Australia 2015, Australian Burden of Disease series no. 19. Cat. no. BOD 22, AIHW, Canberra, accessed 9 July 2023. doi:10.25816/5ebca2a4fa7dc.
AIHW (2023d) Alcohol, tobacco & other drugs in Australia, AIHW, Canberra, accessed 11 July 2023.