QIM 2: Proportion of regular clients with a current smoking status recorded in their GP record

Overview

Tobacco smoking is the leading cause of preventable diseases and death in Australia. Smoking accounted for 8.6% of the total burden of disease in Australia in 2018, making it the leading risk factor contributing to disease burden. Tobacco use contributed to the most deaths and fatal burden with nearly 20,500 deaths attributed to it, which amounts to 13% of all deaths (AIHW 2021b). Successful public health strategies over many decades have resulted in a significant decline in daily smoking proportions. Despite these positive changes, the harm from tobacco smoking continues to affect current smokers and ex-smokers, as well as non-smokers through their exposure to second-hand smoke (AIHW 2019a).

Capture of results recorded outside of the general practice setting

Where a smoking status was recorded elsewhere and the information is not recorded in the clinical information system (CISs) of the client’s usual general practice then these data may not be captured in the report. For example, this might be a result from a smoking rehabilitation centre or community health centre where the information systems may not be compatible with the CISs of the client’s usual general practice.

Other sources of relevant data

Data on prevalence of health risk factors such as smoking status are captured in the National Health Survey (NHS) conducted by the Australian Bureau of Statistics (ABS), the National Drug Strategy Household Survey (NDSHS) conducted by the AIHW and the survey on smoking conducted by the Cancer Council Victoria. 

This indicator contains 2 parts:

  • QIM 2a: Proportion of regular clients aged 15 years and over whose smoking status has been recorded in their GP record:
    • in the last 12 months for those aged 15–29
    • at least once since turning 30 for those aged 30 and over.
  • QIM 2b: Proportion of regular clients aged 15 years and over whose smoking status has been recorded in their GP record (in the last 12 months for those aged 15–29 and at least once since turning 30 for those aged 30 and over) as one of the following: current smoker, ex-smoker or never smoked.

The QIM proportions summarised by the different extraction tools in use are also shown in the ‘Regional proportions’ bar charts for this measure. This illustrates the differences in how software providers have interpreted the technical specifications and coding of QIMs.

Proportion of regular clients with a smoking status recorded (QIM2a)

QIM 2a: Regional proportions

As of July 2023, nationally, 65.1% of regular clients aged 15 years and over had their smoking status recorded in their GP record (where recorded means in the previous 12 months for those aged 15–29 and since the age of 30 for those aged 30 years and over). This varied from 58.0% to 84.1% across PHNs, and between 64.5% and 84.0% across extraction tools.

Figure 13: Proportion of regular clients aged 15 years and over with a smoking status recorded in their GP record, by PHN, or extraction tool (ET), July 2023

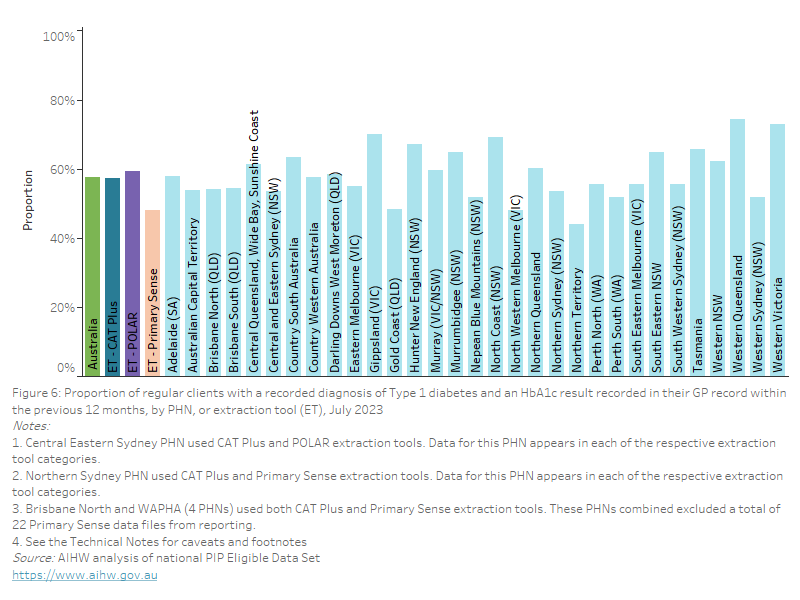
This bar chart shows the proportion of regular clients aged 15 years and over with a smoking status recorded in their GP record, by PHN and extraction tool, for July 2023.

QIM 2a: National proportions over time

Nationally, between January 2023 and July 2023, the proportion of regular clients with a smoking status recorded in their GP record remained constant at 64.5% and 65.1%, respectively.

Figure 14: Proportion of regular clients aged 15 years and over with a smoking status recorded in their GP record, January 2023 to July 2023

This line chart shows the proportion of regular clients aged 15 years and over with a smoking status recorded in their GP record, from January 2023 to July 2023

QIM 2a: National proportions by age and sex

Separate graphs are provided for the 15–34 years and the 35 years and over age groups. It is difficult to compare the results captured in figures 15a and 15b because the counting rules for whether smoking status is recorded changes from the age of 30 years. The age group most affected by this change, 25–34 years, cannot be separated due to the way the specifications were developed. The AIHW is working with stakeholders to review the counting rules behind these specifications and to align the data capture.

As of July 2023, nationally, the proportion of regular clients aged 15 to 34 years whose most recent smoking status was recorded in their GP record was:

  • 18.5% and 15.6%, respectively, for females and males aged 15 to 24 years
  • 29.5% for both females and males aged 25 to 34 years. 

Figure 15a: Proportion of regular clients aged 15–34 years with a smoking status recorded in their GP record, by age and sex, July 2023

This bar chart shows the proportion of regular clients aged 15 to 34 years with a smoking status recorded in their GP record, by age and sex for July 2023

As of July 2023, nationally, the proportion of regular clients aged 35 years and over (whose most recent smoking status was recorded in their GP record since turning 30 years) increased with age and was:

  • highest in the 55–64 year age group for both females (84.3%) and males (84.6%)
  • lowest in the 35–44 year age group for both females (76.6%) and males (75.7%).

Figure 15b: Proportion of regular clients aged 35 years and over with a smoking status recorded in their GP record since turning 30 years, by age and sex, July 2023

This bar chart shows the proportion of regular clients aged 35 years and over with a smoking status recorded in their GP record since turning 30 years, by age and sex for July 2023

Proportion of regular clients with a smoking status result (QIM2b)

QIM 2b: Regional proportions

Current smokers

As of July 2023, nationally, 13.5% of regular clients aged 15 years and over whose smoking status was recorded in their GP record were classified as current smokers. This varied from 6.8% to 20.2% across PHNs, and between 12.3% and 13.9% across extraction tools. 

Figure 16: Proportion of regular clients aged 15 years and over and whose smoking status was recorded and classified as "current smoker" in their GP record, by PHN, or extraction tool (ET), July 2023

This bar chart shows the proportion of regular clients aged 15 years and over and whose smoking status was recorded and classified as "current smoker" in their GP record, by PHN and extraction tool, for July 2023.

Ex-smokers

As of July 2023, nationally, 21.9% of regular clients aged 15 years and over whose smoking status was recorded in their GP record were classified as ex-smokers. This varied from 13.4% to 31.3% across PHNs, and between 19.8% and 22.5% across extraction tools.

Figure 17: Proportion of regular clients aged 15 years and over and whose smoking status was recorded and classified as "ex-smoker" in their GP record, by PHN, or extraction tool (ET), July 2023

This bar chart shows the proportion of regular clients aged 15 years and over and whose smoking status was recorded and classified as "ex-smoker" in their GP record, by PHN and extraction tool, for July 2023.

Never smoked

As of July 2023, nationally, 64.6% of regular clients aged 15 years and over whose smoking status was recorded in their GP record were classified as never having smoked. This varied from 52.8% to 76.5% across PHNs, and between 63.6% and 67.9% across extraction tools. 

Figure 18: Proportion of regular clients aged 15 years and over and whose smoking status was recorded and classified as "never smoked" in their GP record, by PHN, or extraction tool (ET), July 2023

This bar chart shows the proportion of regular clients aged 15 years and over and whose smoking status was recorded and classified as "never smoked" in their GP record, by PHN and extraction tool, for July 2023.

QIM 2b: National proportions over time

Nationally, between January 2023 and July 2023, the proportion of regular clients remained constant:

  • at 13.8% and 13.5%, respectively, for “current smokers”
  • at 22.1% and 21.9%, respectively, for “ex-smokers”
  • at 64.1% and 64.6%, respectively, for “never smoked”.

Figure 19: Proportion of regular clients aged 15 years and over with a smoking status recorded in their GP record, by smoking status, January 2023 to July 2023

This line chart shows the proportion of regular clients aged 15 years and over with a smoking status recorded in their GP record, by smoking status, from January 2023 to July 2023

QIM 2b: National proportions by age and sex

Current smokers

As of July 2023, nationally, the proportion of regular clients whose smoking status was recorded in their GP record and who were classified as current smokers was:

  • highest in the 45–54 year age group for females (14.4%) 
  • highest in the 25–34 year age group for males (22.5%)
  • lowest in the 65 years and over age group for both females (6.5%) and males (8.6%).

Figure 20: Proportion of regular clients aged 15 years and over whose smoking status was recorded and classified as “current smoker” in their GP record, by age and sex, July 2023

This bar chart shows the proportion of regular clients aged 15 years and over whose smoking status was recorded and classified as “current smoker” in their GP record, by age and sex for July 2023

Ex-smokers

As of July 2023, nationally, the proportion of regular clients whose smoking status was recorded in their GP record and who were classified as ex-smokers was:

  • highest in the 65 years and over age group for both females (24.1%) and males (39.3%)
  • lowest in the 15–24 year age group for both females (4.1%) and males (4.4%).

Figure 21: Proportion of regular clients aged 15 years and over whose smoking status was recorded and classified as “ex-smoker” in their GP record, by age and sex, July 2023

This bar chart shows the proportion of regular clients aged 15 years and over whose smoking status was recorded and classified as “ex-smoker” in their GP record, by age and sex for July 2023

Never smoked

As of July 2023, nationally, the proportion of regular clients whose smoking status was recorded in their GP record and who were classified as never having smoked was:

  • highest in the 15–24 year age group for both females (84.1%) and males (78.4%)
  • lowest in the 55–64 years and over age group for females (63.0%)
  • lowest in the 65 years and over age group for males (52.1%).

Figure 22: Proportion of regular clients aged 15 years and over whose smoking status was recorded and classified as “never smoked” in their GP record, by age and sex, July 2023

This bar chart shows the proportion of regular clients aged 15 years and over whose smoking status was recorded and classified as “never smoked” in their GP record, by age and sex for July 2023