Summary
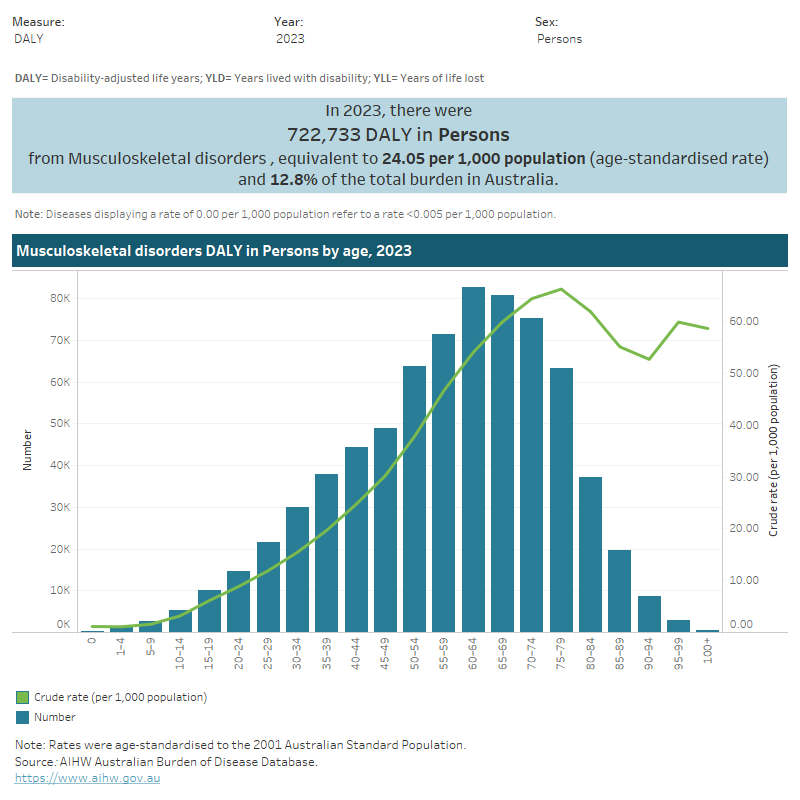
This figure shows that the prevalence of musculoskeletal conditions increased with age, from 14% for persons aged 0–44 to 68% for persons aged 75 and over.

This figure shows that 40% of females aged 45 and over had arthritis in 2017–18.

This figure shows that 39% of persons living in the lowest socioeconomic area had arthritis in 2017–18.

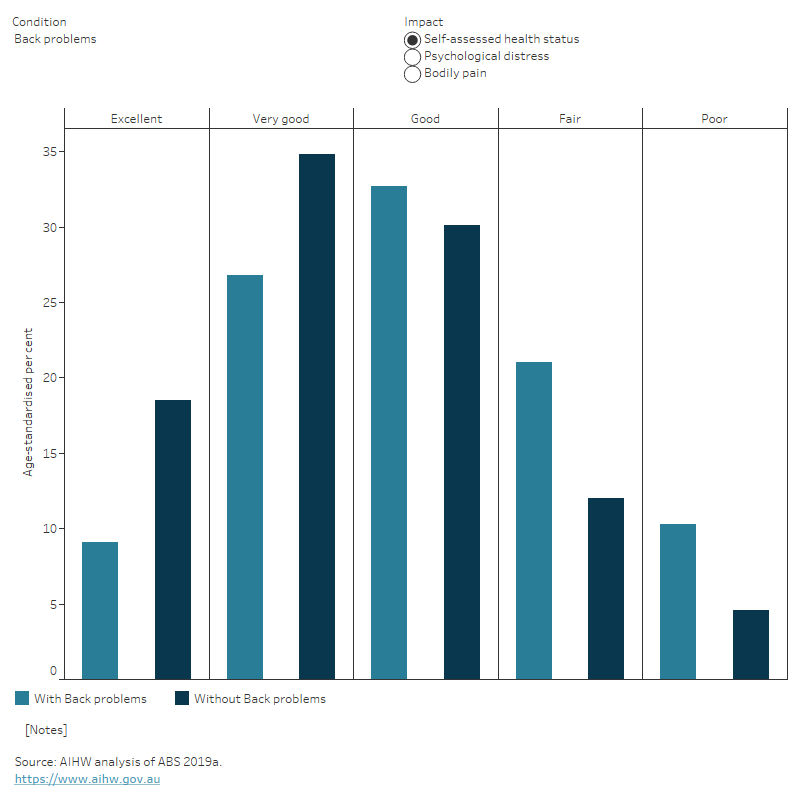
This figure shows that people with arthritis aged 45 and over were less likely to report having ‘excellent’ health compared with those without the condition.
This figure shows the fatal burden from musculoskeletal conditions was highest for people aged 75–79 (3.0 YLL per 1,000 population).
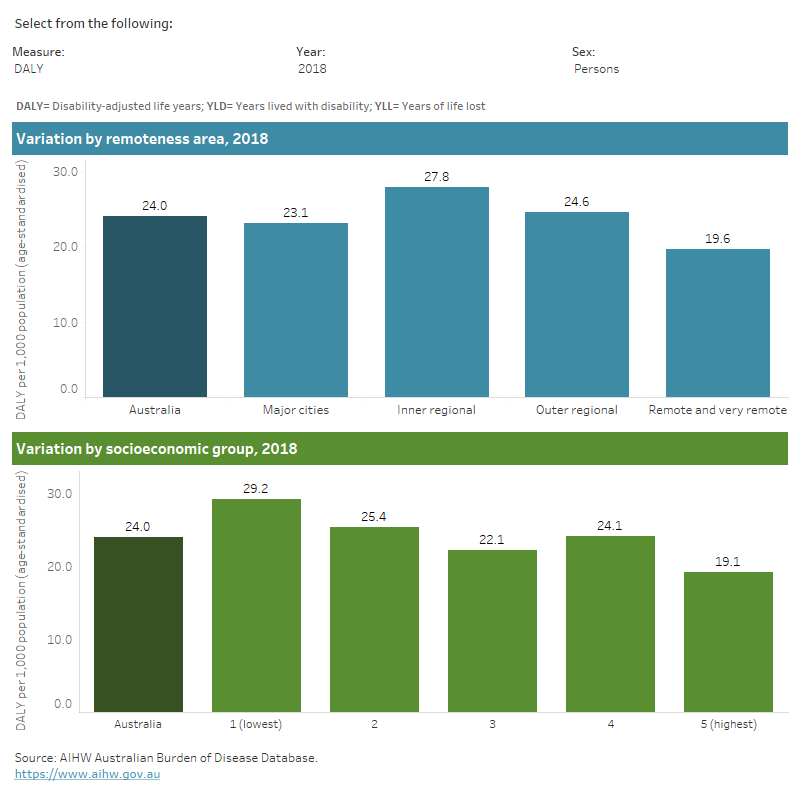
This figure shows that in 2018, the total burden of disease due to musculoskeletal conditions was highest for people living in Inner regional areas.
This figure shows that the public admitted patients’ hospital proportion of musculoskeletal expenditure was 21% or $3.1 billion in 2020–21.
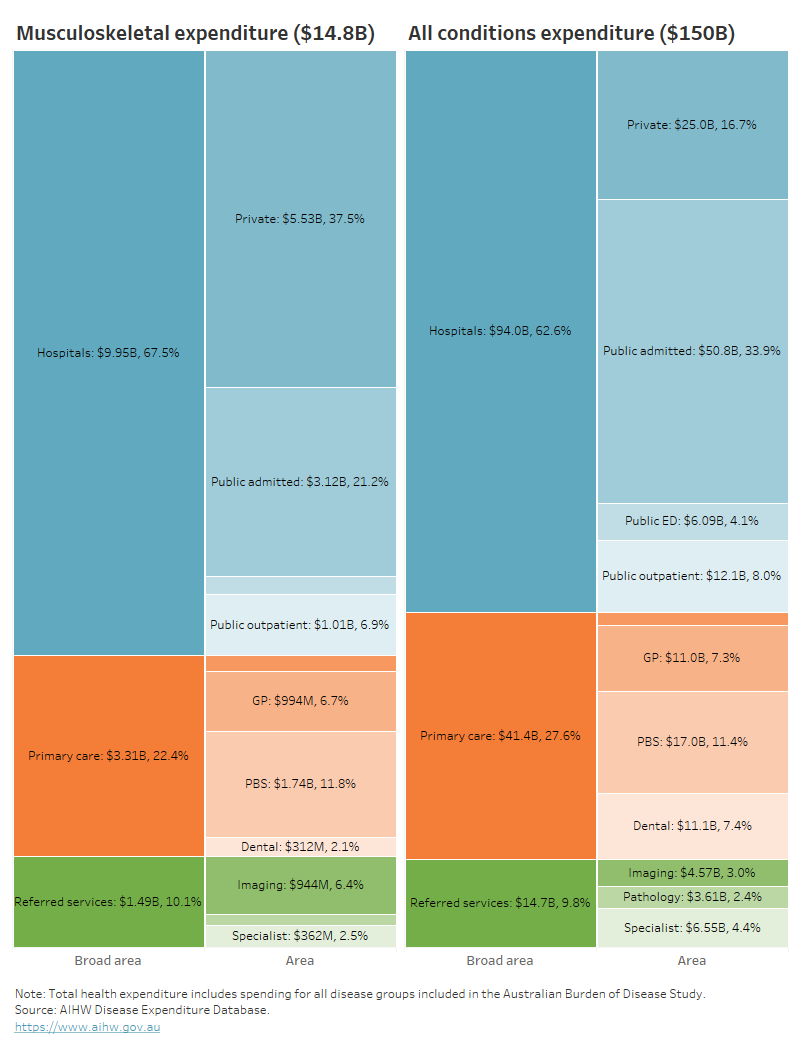
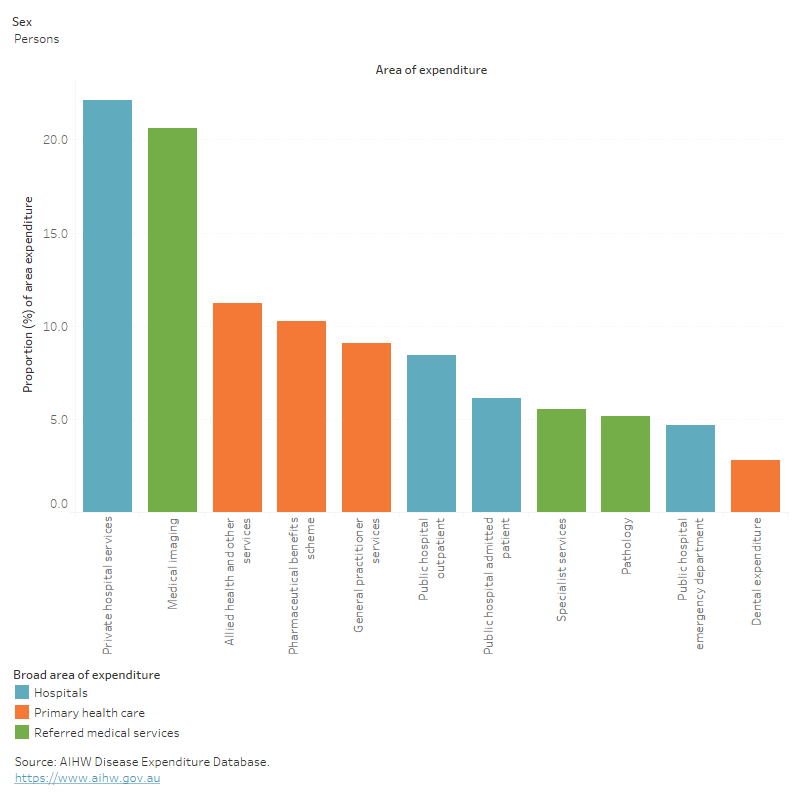
This figure shows musculoskeletal conditions accounted for 11% of all allied health and other services expenditure in 2020–21.
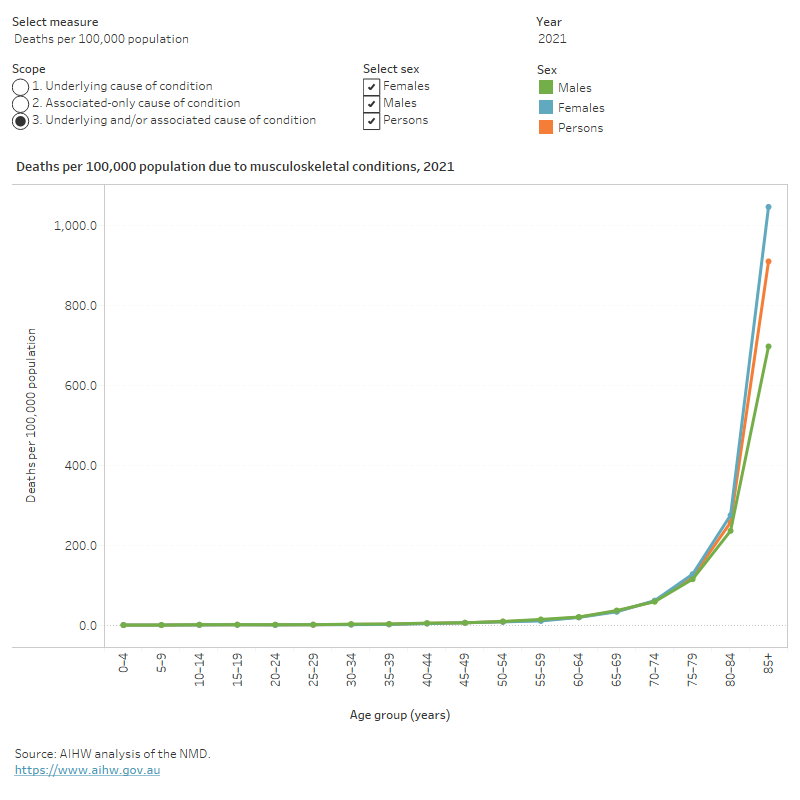
This figure shows that the death rates due to musculoskeletal conditions increased with age and was highest for people aged 85 and over.
This figure shows deaths due to musculoskeletal conditions increased steadily from 2011 to 2017, decreased between 2017 and 2020 and increased again in 2021.

This figure shows that in 2021–22 hospitalisations for musculoskeletal conditions increased with age until 75–79 years, declining thereafter.

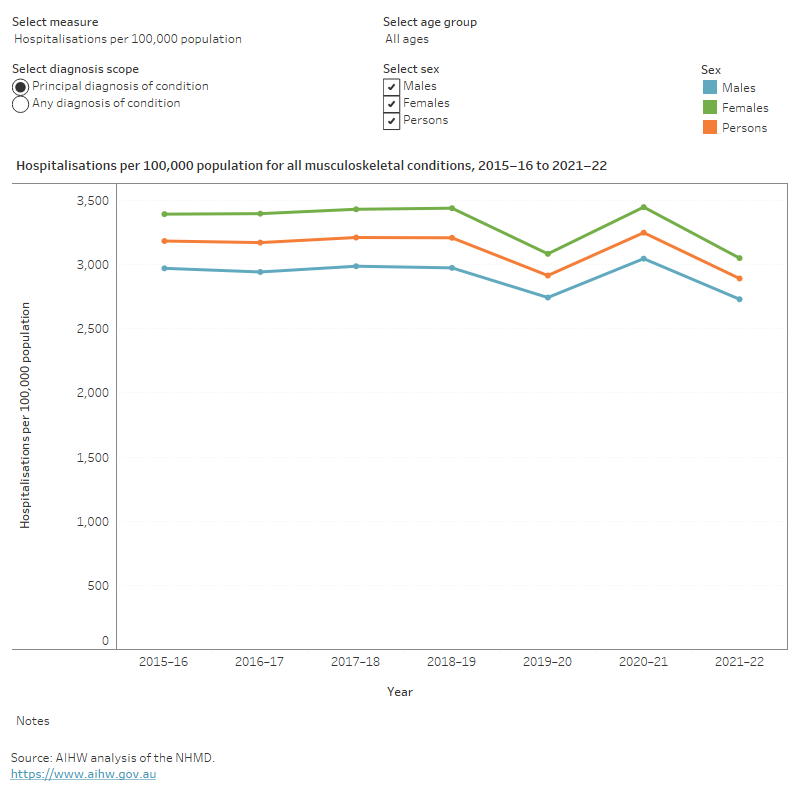
This figure shows that the hospitalisation rates for musculoskeletal conditions were consistently higher for females compared to males.
This figure shows that in 2021, there were between 2,000 and 4,000 separations per month for hip replacements where osteoarthritis was the principal diagnosis.
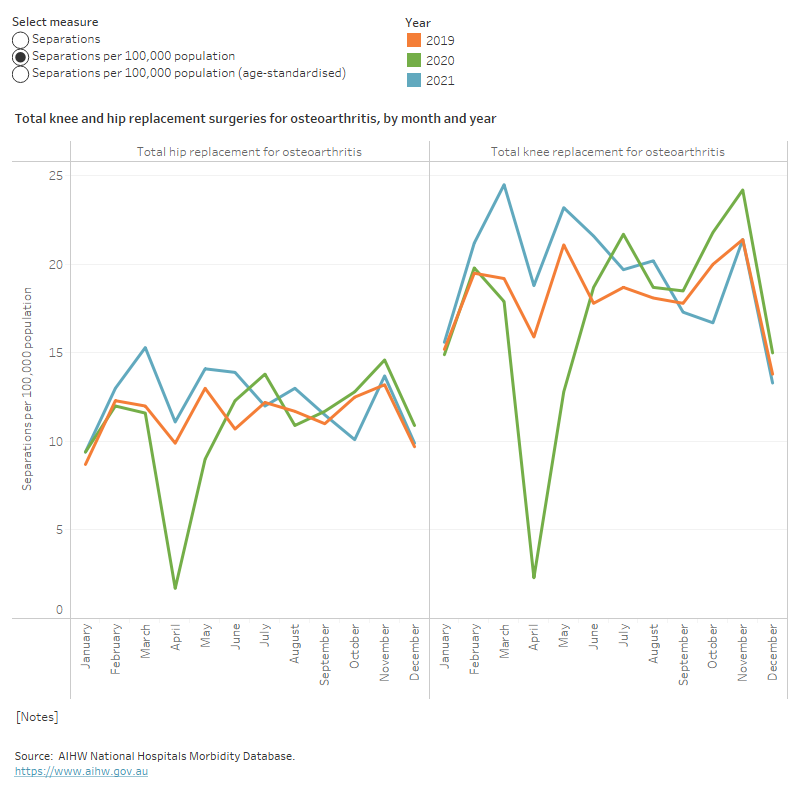
Waiting times for elective surgeries increased notably for 2020–21 admissions. In 2020–21, the median waiting times for total hip replacement surgery and total knee replacement surgery increased on 2019–20 by 49% and 38% respectively. This compares to an increase of 23% for all elective surgery (AIHW 2021b).
In 2020–21, the percentage of total hip replacements and total knee replacements with waiting times exceeding one year were 21% and 32% respectively. These represent 13 and 20 percentage point increases on 2019–20, which compare to a 4.8 percentage point increase for all elective surgeries (AIHW 2021b).
Comorbidities of chronic musculoskeletal conditions
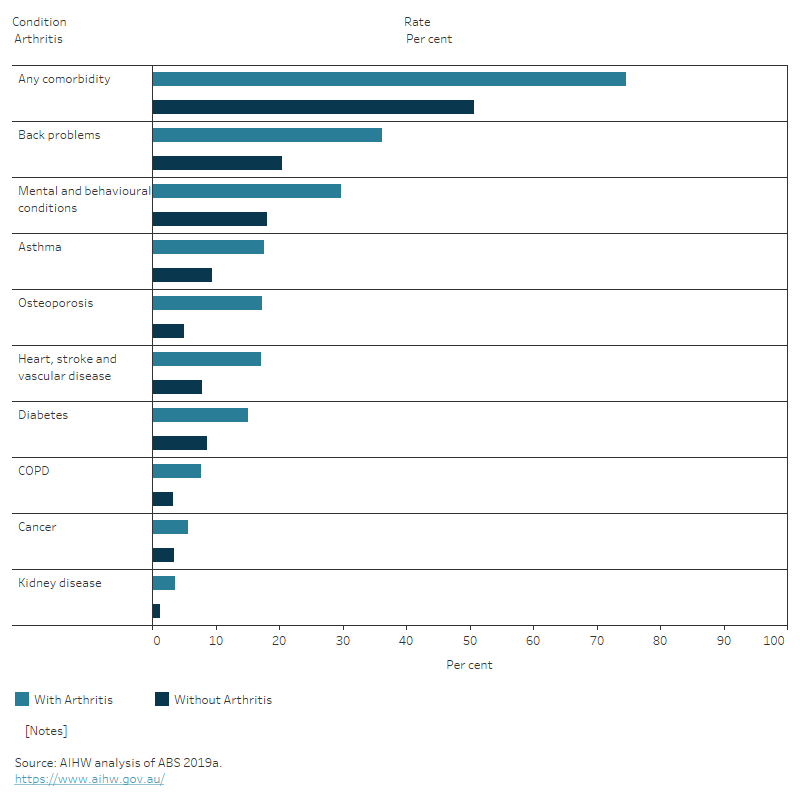
People with musculoskeletal conditions often have other long-term conditions (comorbidities) (Figure 14).
Figure 14: Proportion of people with selected musculoskeletal conditions and 1 or more comorbidity, 2017–18
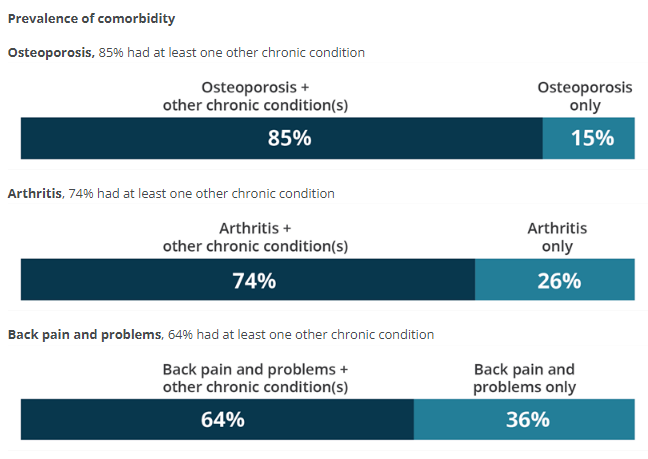
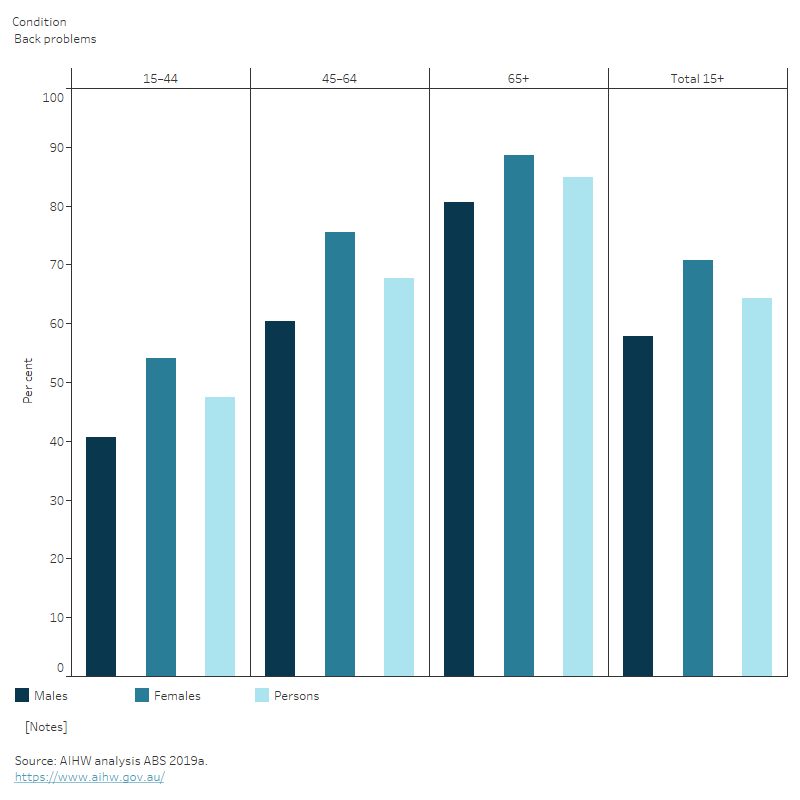
The number of comorbidities varies by age and sex. For example, the proportion of people with back problems who had at least one other chronic condition increased with age, from 47% (aged 1544) to 85% (aged 65 and over). Among those with back problems, the proportion of people with comorbidities was higher in females than males across all age groups (Figure 15).
Figure 15: Proportion of people with musculoskeletal conditions who have at least one other chronic condition in people aged 15 and over, by sex and age, 2017–18
This figure shows that with the prevalence of having at least one other chronic condition increased with age.
This figure shows that reporting of selected chronic conditions was more common in people aged 45 and over with musculoskeletal conditions than those without.