Burden of disease due to dementia

Burden of disease analysis measures the combined impact of living with illness and injury (non-fatal burden) and dying prematurely (fatal burden). The fatal and non-fatal burden summed together is referred to as the total burden, measured using disability-adjusted life years (DALY). One DALY is equivalent to 1 year of healthy life lost. Burden of disease allows for comparisons of all diseases, illness and injury, by taking into account not only the number of people affected but the severity and duration of illness, as well as the age of people who died (AIHW 2022).

The Australian Burden of Disease Study (ABDS) 2022 provides the most up-to-date information on the burden of disease in Australia at a national level. Burden of disease estimates for the Australian population in 2022 are presented in the Australian Burden of Disease Study 2022 web report.

The ABDS 2018 provides the most up-to-date information for burden of disease estimates by state and territory, remoteness and socioeconomic area, as well as estimates of disease burden attributable to risk factors (AIHW 2021). Detailed estimates from the Australian Burden of Disease Study 2018 can be found at Disease burden: interactive data and Risk factors: interactive data.

Refer to Burden of disease due to dementia among First Nations people for information based on these latest available estimates.

Refer to the Burden of disease data tables for the underlying data presented in these pages. 

Dementia is a leading cause of disease burden in Australia

In 2022, dementia was the second overall leading cause of burden of disease and injury in Australia, behind coronary heart disease. Dementia was responsible for 4.4% of the total burden of disease in Australia, equivalent to around 242,000 healthy years of life lost (DALY), or 6.4 DALY per 1,000 people. Dementia was the leading cause of disease burden for females overall, 146,000 DALY of the total burden due to dementia. In comparison, dementia was the fifth leading cause of disease burden for men (95,900 DALY).

Age is the biggest risk factor for dementia, and its ranking as a leading cause of disease burden increased as age increased (Figure 4.1). From age 65 onwards, dementia was the leading cause of disease burden among Australians overall. However, this was largely due to the high disease burden among females. For men aged 80 and over, dementia was the second leading cause of disease burden behind coronary heart disease.

Figure 4.1: Leading 10 causes of disease burden (DALY) in Australia in 2011, 2015, 2018 and 2022: by sex and age

Figure 4.1 is a bar graph showing the leading 10 causes of disease burden (by disability-adjusted life years) in Australia by sex and age in 2022. Overall, dementia was the second leading cause of disease burden in Australia, behind coronary heart disease. Overall, dementia is the leading cause of disease burden for women, and the fifth leading cause for men. Dementia becomes a higher ranked cause of disease burden with increasing age; it was the leading cause of disease burden among Australians aged 80 and over. This is mainly due to the high disease burden among women aged 80 and over.

Over half (59%) of the total burden due to dementia was from dying prematurely (about 142,000 YLL). The proportion of burden due to dying prematurely was higher in males (64% or 61,800 YLL) compared with females (55% or 79,800 YLL) (Table S4.3).

The fatal burden, or years of life lost (YLL) is the difference between a person’s age at death, and the age at which that person would have expected to live to according to an aspirational life table. Fatal burden for dementia was calculated based on deaths where dementia was the underlying cause of death. It does not include deaths where dementia was an associated cause of death (see Dying due to dementia compared to dying with dementia more information).

Conditions that cause deaths at younger ages (such as Sudden Infant Death Syndrome) have a much higher number of YLL per death than conditions like dementia, which cause death at older ages (as there are more years of life to lose). So while the number of YLL decreases with increasing age, as there were more people dying due to dementia in the older age groups, the number of YLL due to dementia increases with increasing age. The number of disability-adjusted life years or DALY (which is the sum of the years of life lost (YLL) and years lived with disability (YLD)) was greatest between ages 80 and 94, peaking slightly younger in men (age 80–84) compared with women (age 85–89) (Figure 4.2). From age 95 onwards there was a sharp decline in the number of DALY due to a smaller population at this age. However, the rate of DALY due to dementia continued to increase with increasing age.

Figure 4.2: Dementia burden in Australia in 2011, 2015, 2018 and 2022 by sex and age: number (YLL, YLD) and age-specific rate (DALY per 1,000 people)

Figure 4.2 is a stacked bar graph showing the number of years of life lost and years lived with disability due to dementia by age (which added together equal to disability-adjusted life years, or DALY) and a line graph showing the age-specific dementia DALY rate, in Australia by sex and year (2011, 2015, 2018 and 2022). It shows that the number of years of life lost and years lived with disability due to dementia increases up to age 85–89 and then decreases in the oldest age groups. Years of life lost due to dementia becomes an increasing cause of the disease burden due to dementia with increasing age. The rate of DALY due to dementia increases with increasing age, and was highest among people aged 100 or over. Overall patterns were similar for each year presented.

Burden due to dementia increased between 2011 and 2022

Dementia has risen from the fourth leading cause of disease burden in 2011 (behind coronary heart disease, back pain and lung cancer) to be the second leading cause in 2022 (behind coronary heart disease).

There was a slight increase in the age-adjusted rate of total burden due to dementia between 2011 and 2022, from 5.8 DALY to 6.4 DALY per 1,000 people, due to an increase in fatal burden (from 3.1 YLL to 3.8 YLL per 1,000 people) (Figure 4.3). Due to the lack of high-quality data on dementia prevalence (number of people with dementia) and associated disease severity in Australia, the same prevalence and severity rates were used to estimate the non-fatal burden due to dementia in 2011, 2015, 2018 and 2021. As such, there is no change in the YLD rates between 2011 and 2021.

Improvements in estimating dementia prevalence will assist in future calculations of the burden of disease due to dementia in Australia. Refer to Prevalence of dementia for more information on the work that is being done to improve dementia prevalence estimates for Australia. 

Figure 4.3: Dementia burden in Australia in 2011, 2015, 2018 and 2022, by sex: age-standardised YLL, YLD and DALY per 1,000 people

Figure 4.3 is a bar graph showing the age-standardised rate of years of life lost, years lived with disability and disability-adjusted life years due to dementia in Australia in 2011, 2015, 2018 and 2022 by sex. There was a slight increase in the rate of disability-adjusted life years due to dementia between 2011 and 2022, due to an increase in the rate of years of life lost due to dementia. Due to the lack of high-quality data on dementia prevalence, the same prevalence and severity rates were used to estimate the years lived with disability due to dementia in each year, resulting in no changes in the rates of years lived with disability due to dementia between 2011 and 2022.

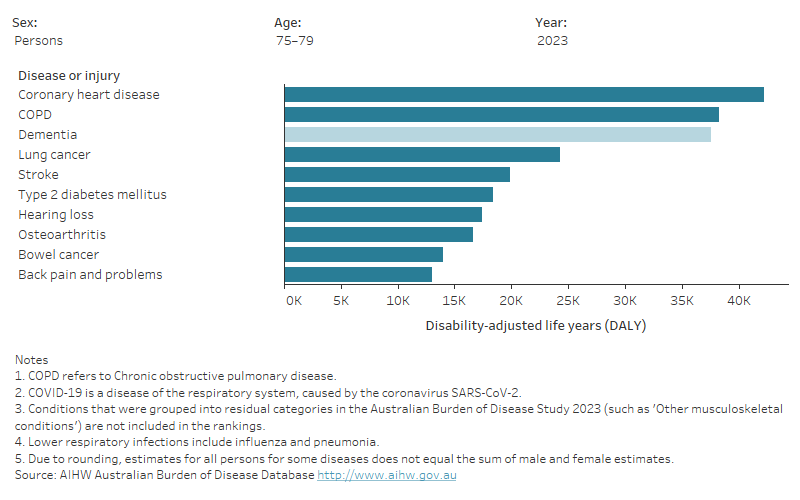
Dementia burden differed across population groups

The disease burden experienced in a population (both the amount and types of disease or injury) are influenced by a number of geographic and socioeconomic factors, such as income, education, employment and access to health and social support services.

In the ABDS 2018, remoteness areas are based on an area’s relative distance to services and divided into 4 areas: Major cities, Inner regional, Outer regional and Remote/Very remote areas. Socioeconomic areas are presented as quintiles and based on a number of socioeconomic characteristics (such as household income, employment and education levels) of the area where a person lives. Quintile 1 represents the 20% of the population living in areas with the greatest overall level of disadvantage whereas Quintile 5 represents the 20% living in areas with the least overall level of disadvantage.

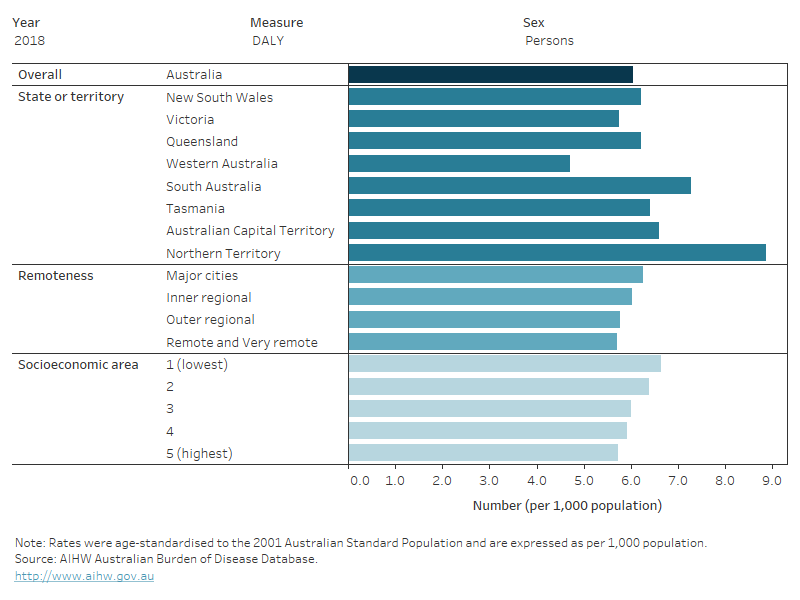
In 2018, the age-standardised DALY rate due to dementia varied by geographic and socioeconomic area (Figure 4.4):

  • The Northern Territory had the highest rate of dementia burden (8.9 DALY per 1,000 people), and was much higher than the national rate (6.1 DALY per 1,000 people).
    • This is likely due to a combination of factors including, the Northern Territory having a younger                    demographic and greater proportion of First Nations people compared with other states and territories, as well as increased prevalence of a number of known risk factors for dementia compared with other states and territories.
  • Western Australia had the lowest rate of dementia burden of all the states and territories (4.7 DALY per 1,000 people).
  • Major cities had the highest rate of dementia burden (6.3 DALY per 1,000 people) and Outer regional and Remote/ Very remote areas had the lowest rates (5.8 and 5.7 DALY per 1,000 people, respectively).
  • People who lived in the lowest socioeconomic area (Quintile 1) had the highest rate of dementia burden (6.6 DALY per 1,000 people), and the rate of dementia burden decreased with each increasing socioeconomic quintile.

Between 2011 and 2018, changes in the rate of dementia burden varied by state. The rate declined for the Northern Territory, Tasmania and Western Australia (by between 0.5 to 1.0 DALY per 1,000 people); rose for the Australian Capital Territory, New South Wales and Queensland (by between 0.6 to 0.8 DALY per 1,000 people); and remained relatively steady for Victoria.

The rate of burden rose for all remoteness areas and by a similar amount between 2011 and 2018; whereas, it was either steady or rose only slightly for most socioeconomic areas, with the exception of the lowest socioeconomic area which increased from 5.6 to 6.6 DALY per 1,000 people.

Note, patterns in state and territory YLD rates differ to the state and territory prevalence estimate patterns shown in Prevalence of dementia. For burden of disease analyses, prevalence estimates were derived by applying the state and territory proportions of deaths due to dementia to the national prevalence estimates, and then multiplying by the associated disability weights (measure of health loss) to obtain YLD estimates for dementia.

Figure 4.4: Dementia burden in 2011, 2015 and 2018, by geographic and socioeconomic areas and sex: DALY, YLL and YLD per 1,000 people

Figure 4.4 is a bar graph showing the age-standardised rates of years of life lost (YLL), years lived with disability (YLD) and disability-adjusted life years (DALY) due to dementia in Australia in 2011, 2015 and 2018 for men, women and persons by state or territory, remoteness and socioeconomic areas. In 2018, dementia DALY rates were highest rates in the Northern Territory, Major cities and the lowest socioeconomic area, and were lowest in Western Australia, Outer regional and Remote/ Very remote areas and the highest socioeconomic areas. Between 2011 and 2018, dementia DALY rates decreased for the Northern Territory, Tasmania and Western Australia and increased for the Australian Capital Territory, New South Wales, and Queensland, as well as for all remoteness areas. In 2011, dementia DALY rates were similar across socioeconomic areas, but between 2011 and 2018, dementia DALY rates increased for the lowest socioeconomic areas only.